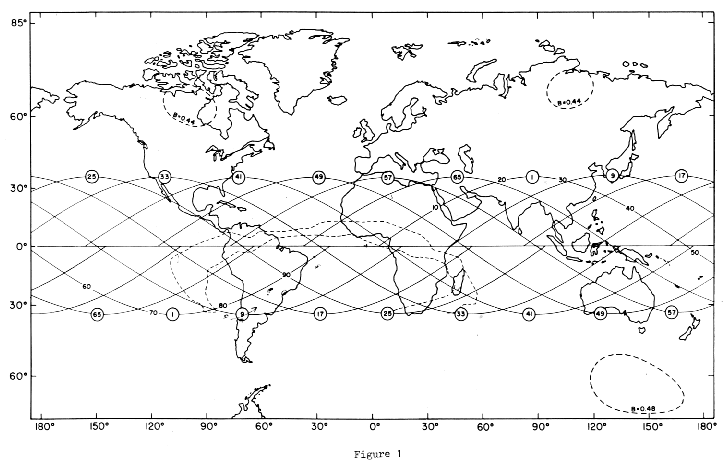
- Figure 1.
- Mercator projection of the Earth showing the path over the surface of
the Earth followed by the satellite in standard orbits 1, 9, 17, 25, 33,
41, 49, 57 and 65; the time since the crossing of the node (TSN) for
standard orbit 1 (marked as 10, 20, 30, ... , 90 spacecraft minutes); the
anomaly contours used in scheduling satellite observations (dashed lines
over the South Atlantic -- the inner contour is used for O and B stars
brighter than 3rd magnitude and 1000 Å < Lambda < 1350 Å,
2000 Å < Lambda < 3200 Å, while the large contour is used
for all other stars or wavelength regions); and contours for the magnetic
flux near B ~ 0.5 in Gauss, at a height of 700 km.
Return to main paper.