Preliminary performance estimates for the Far Ultraviolet Spectroscopic
Explorer (FUSE) satellite
David J. Sahnowa, Scott D. Friedmana, H. Warren Moosa, James C. Greenb, and Oswald H. W.
Siegmundc
a Center for Astrophysical Sciences, Department of Physics and Astronomy, The Johns Hopkins
University, Charles & 34th Streets, Baltimore, MD 21218
bCenter for Astrophysics & Space Astronomy, University of Colorado, Campus Box 593, Boulder, CO
80309-0593
cSpace Sciences Laboratory, University of California, Berkeley, CA 94720
ABSTRACT
The Far Ultraviolet Spectroscopic Explorer (FUSE) satellite will make high spectral resolving power (/ = 20,000 - 30,000)
measurements of astrophysical objects in the 905-1187 Å wavelength region from low-earth orbit. Its high effective area (20 -
70 cm2) and low background will permit observations of solar system, galactic, and extragalactic targets that have been too faint
for previous instruments at this high resolution.
Integration and test of the FUSE satellite is currently underway in preparation for a launch readiness date in late 1998. We
describe the current status of the FUSE satellite, including details of the optical and mechanical measurements made during
component and subsystem-level testing. In addition, we make an estimate of instrument on-orbit performance from data obtained
during instrument integration and test.
astrophysics, FUSE, spectroscopy, ultraviolet, instrumentation
1. INTRODUCTION
Since the Copernicus mission in the 1970s, there have been no long term missions designed to obtain spectra in the
astrophysically important far ultraviolet (~900 - 1200 Å). Other missions, such as HUT, IMAPS, and ORFEUS have operated
in the far ultraviolet, but they were not long duration missions and did not combine the large effective area, high resolution, and
wide wavelength coverage necessary to fully explore this spectral region.
The Far Ultraviolet Spectroscopic Explorer (FUSE) was designed to fill this gap. FUSE will obtain spectra in the far ultraviolet,
in the wavelength range of 905 to 1187 Å with high resolving power (/ = 20,000 - 30,000) and high effective area (20 - 70
cm2). These attributes, combined with a low background, will permit observations of solar system, galactic, and extragalactic
targets that have been too faint for previous instruments to explore at this high resolution. FUSE will have a limiting flux of 10-14
erg cm-2 s-1 Å-1, which is sufficient to observe several dozen extragalactic objects.
FUSE is a pathfinder for the Principal Investigator (PI) managed Explorer program. Under this new structure, the Johns Hopkins
University (JHU) has been responsible for all aspects of the program (except the launch vehicle), including maintaining the cost
cap and schedule constraints imposed by NASA. The FUSE program is a collaboration between JHU (science oversight, project
management, systems engineering, mirror assemblies, integration and test, mission and science operations), the University of
Colorado (optical design, spectrograph integration and test, bright object sensor), the University of California, Berkeley (FUV
detectors), the Canadian Space Agency (Fine Error Sensors), and the Centre National d'Etudes Spatiale (diffraction gratings).
Other partners include Swales and Associates (mechanical design, engineering support), the JHU Applied Physics Laboratory
(flight software, engineering support,integration and test), Orbital Sciences Corporation (spacecraft), Allied Signal Technical
Services (mission operations), University of Puerto Rico - Mayaguez (ground station site), Interface & Control Systems
(software), Space Telescope Science Institute (science data processing, data archive), and Goddard Space Flight Center (Guest
Investigator program). In addition, a science team composed of internationally recognized experts in ultraviolet spectroscopy
helps the PI define the mission objectives and carry out several large scientific programs in order to meet these objectives.
As a PI-class mission, the science team has been awarded a significant fraction of the observing time in the early part of the
mission. This time will be used for pursuing several large projects, including determining the abundance of deuterium in a variety
of astrophysical environments, and measuring the amount and distribution of the Ovi ion in the Milky Way and Magellanic
Clouds. These projects, and other complementary investigations which will be carried out by the science team, comprise
approximately 40% of the available observing time over the three year mission life. The remainder of the observation time is
available for guest investigators from the astronomical community at large.
FUSE will be launched aboard a Delta II expendable launch vehicle from Cape Canaveral Air Station. It will be launched into
a 775 km, 25 inclination orbit with a 100 minute period. Both Mission Operations and Science Operations will be conducted
at a Spacecraft Control Center located at the Johns Hopkins University. Scientific observations will begin after a two month
period of in orbit checkout and scientific verification is completed.
2. MISSION DESCRIPTION
 An artist's conception of the FUSE satellite is shown in Figure 1. The satellite consists of the scientific instrument (the larger,
upper section in the figure) and a spacecraft (the smaller, trapezoidal section). These two pieces were designed to have a simple
interface in order to allow independent, parallel development of
the two sections, which minimized development time. In the
FUSE design, nearly all non-science related functions such as
pointing, power, and attitude control reside in the spacecraft,
separate from the scientific instrument.
An artist's conception of the FUSE satellite is shown in Figure 1. The satellite consists of the scientific instrument (the larger,
upper section in the figure) and a spacecraft (the smaller, trapezoidal section). These two pieces were designed to have a simple
interface in order to allow independent, parallel development of
the two sections, which minimized development time. In the
FUSE design, nearly all non-science related functions such as
pointing, power, and attitude control reside in the spacecraft,
separate from the scientific instrument.
A consequence of the 'faster, better, cheaper' philosophy required
for a PI-class mission was the development of a robust design
which could be constructed quickly, yet was expected to be
reliable even in the face of an aggressive development schedule.
For example, the instrument design is inherently redundant, so that
even if a single optical element should fail completely, the mission
would not be lost (although the amount of data obtained would
decrease). This type of design does not involve flying backup
components which will most likely never be used in flight, but
nonetheless allows for component degradation with time. For
instance, the instrument utilizes parallel optical channels with
overlapping capabilities as discussed below.
A schematic of the ultraviolet channels of the FUSE instrument is
shown in Figure 2. The instrument consists of four coaligned
channels, each consisting of an off-axis parabolic telescope mirror, a Focal Plane Assembly containing the spectrograph entrance
apertures, a spherical, aberration-corrected, holographically-ruled diffraction grating in a Rowland mount, and one-half of a two
dimensional double delay line microchannel plate detector. The optics on two of the channels are coated with silicon carbide
(SiC), while the other two are coated with lithium fluoride (LiF) over aluminum. SiC has a relatively constant reflectivity
throughout the far ultraviolet, while Al+LiF has a much higher reflectivity above ~1025 Å. The four channel design permits the
use of multiple optical coatings to optimize the instrument sensitivity. The use of two channels with each coating permits nearly
the entire wavelength region to be covered by more than one channel. The optical design has been discussed in detail elsewhere.(1)
Not shown in this figure are the telescope baffles and the Fine Error Sensors (FESs) which are part of a visible-light channel
using the LiF mirrors and the light which does not pass through the FPA entrance apertures. This channel is used to identify and
track guide stars in the region around the science target in order to maintain the pointing to better than 0.5 arcsecond.
In flight, each of the four channels can be coaligned by tipping and tilting the mirrors, and moving the Focal Plane Assemblies
in the spectral and focus directions. Each Focal Plane Assembly contains four apertures; the choice of aperture is made by the
pointing of the entire satellite. Details of the instrument optomechanical design have been given previously.(2)
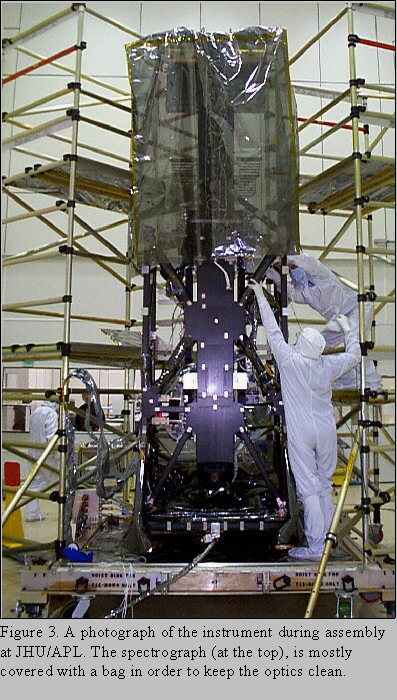
Figure 3 shows a photograph of the instrument just after the spectrograph and telescope structures were bolted together during
instrument integration and test. The entire structure is approximately 4 meters tall. At the time this photo was taken, most of
the electronics had not been installed, and a bag still covered the spectrograph in order to keep it clean during the assembly
process. Although much of the spectrograph cavity is obscured by this bag, the grating mounts are visible near the top, along with
the internal spectrograph baffles.
After launch, satellite operations will be run from a Spacecraft Control Center which has recently been constructed at the Johns
Hopkins University. Both science and mission operations will be located in this facility in an effort to minimize operations costs
and improve efficiency.
3. CURRENT STATUS
At this time, nearly all of the flight hardware has been delivered, and instrument integration and test (I&T) has begun. This
section describes the status and performance of the major satellite systems as of mid-March, 1998.
3.1. Instrument
As shown in Figure 3 above, the instrument structure is fully assembled and has most of the optical elements installed. During
the winter and spring of 1998, the remainder of the optical and electronic components will be integrated, and the optical alignment
of the telescope mirrors to the spectrograph will be made. Other major milestones are the installation and testing of the two FESs,
and the installation of the telescope baffles.
3.1.1. Baffles
Construction of the telescope baffles is complete, although they have not yet attached to the instrument structure. The baffles,
which are primarily used for reducing visible scattered light in the FES, have been tested with a prototype FES. Based on those
tests, the visible light channel is expected to exceed its requirements, and allow observations of targets as close as 20 from the
bright earth limb with 0.5 arcsecond pointing stability.
3.1.2. Mirror Assemblies
The two SiC coated mirror assemblies are fully assembled, including their actuators and thermal enclosures, and have been
delivered to instrument I&T. The figure errors, midfrequency errors, and microroughness have all been measured, and meet the
requirements necessary to achieve its requirement of 90% encircled energy in 1.5 arcseconds. However, due to time constraints,
no direct imaging test was performed. The LiF coated mirrors are currently being assembled and will be delivered to instrument
I&T in March, 1998. As with the SiC mirrors, the figure is measured at each stage of assembly to verify that the surface has not
been distorted by the assembly process.
An additional flight spare mirror was manufactured using exactly the same optical measurement procedures as the four flight
mirrors. This mirror will be subject to extensive figure testing, as well as imaging tests, using both a pinhole to directly measure
encircled energy and knife-edge tests to more precisely determine the shape of the point spread function. These imaging tests will
be done at 6328 and 2537 Å, and, if time permits, at 1849 Å. Additional details of the mirror assemblies are described in Ohl
et al.(3)
3.1.3. Spectrograph
Spectrograph integration and test took place at the University of Colorado from early 1997 to February 1998, when the
spectrograph was shipped to the Johns Hopkins University Applied Physics Laboratory (APL) for integration with the remainder
of the instrument. During spectrograph I&T, the Focal Plane Assemblies, gratings, and detectors were mechanically and optically
coaligned, and the four spectrograph channels were characterized. Spectra were taken through a variety of slits in order to
measure the spectral resolution (see section 4.2). The alignment and performance of the spectrograph during I&T is described
separately by Wilkinson et al.(4)
3.1.4. Detectors
 The FUSE detector subsystem consists of two detectors, each made up of two individual 88.5 mm 10 mm microchannel plate
(MCP) segments with ~7 mm separation between them. The front surface of the MCP z-stacks are curved in order to match the
Rowland circle diameter. Each segment of a detector is independently operable, but both are within a single integrated detector
body subassembly.
The FUSE detector subsystem consists of two detectors, each made up of two individual 88.5 mm 10 mm microchannel plate
(MCP) segments with ~7 mm separation between them. The front surface of the MCP z-stacks are curved in order to match the
Rowland circle diameter. Each segment of a detector is independently operable, but both are within a single integrated detector
body subassembly.
A series of tests were performed on the detector systems prior to spectrograph integration to establish their performance
characteristics, including: gain-voltage, pulse height distribution, background rate and position distribution, quantum detection
efficiency, image linearity and distortion, resolution, counting rate stability, electronics dead time, flat field uniformity (fixed
pattern noise), and thermal stability.(5) The MCPs used achieve an overall uniform background rate of ~0.35 events cm-2 s-1 at a
15% modal gain threshold, which is in accord with the intrinsic MCP 40K -decay in the glass. We expect the rate to increase
by about a factor of two in orbit due to the cosmic ray contribution.
KBr opaque photocathodes were deposited on the top MCP of each segment and provide quantum detection efficiencies of
~20-40% in the FUSE bandpass. The overall electronics speed shows that count rates of up to 10 events pore-1 s-1 can be
accommodated, although it is not advisable to sustain this rate due to overall MCP lifetime constraints.
To evaluate the resolution, we have measured the point spread functions for an array of small (10 m) pinhole images. The
resolution is as small as 15 m FWHM in the spectral direction (electronic binning is 6 m) and ~50 m in the perpendicular
direction (binned to 10 - 16 m, depending on segment) in the central areas of the detector, and increasing to 35 and 70 m at
the edges. The image linearity measured using the centroid positions of images of the test-mask pinholes shows that the position
deviations are typically correctable to less than ~25 m. The worst case thermal position drift is of the order of 40 m at the ends
of the image segments over a 10 C excursion, largely due to thermal coefficients of the image encoding electronics.
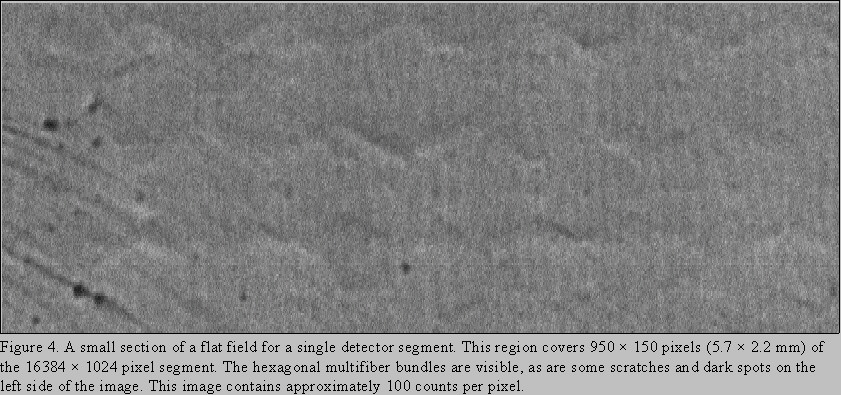
The fixed pattern uniformity of the detectors was evaluated by flooding the detector with a light from a UV lamp. Figure 4 shows
a 950 150 pixel (5.7 2.2 mm) section of a full flood image which was taken with high statistics (~100 counts/pixel). This
"flat field" shows the MCP multifiber modulation effects as well a few dark spots due to defects in the MCPs, surface marks
on the MCPs and some residual Moire modulations. Given the high resolution performance required, these effects must be
carefully corrected in order to achieve the desired overall performance.
3.1.5. Fine Error Sensors
The hardware for the two Fine Error Sensors will be complete by late March. After approximately one month of qualification,
they will be delivered to instrument I&T and be installed into the instrument. A qualification unit was shown to meet all
specifications, with the important internal scattering exceeding specifications.
3.1.6. Other instrument systems
One of the two Instrument Data Systems (instrument computers) has been installed in the instrument, and the second is being
used for software development. The final software delivery is scheduled for late March. Spacecraft communications and data
handling, instrument telemetry and communications with the subsystems has been mostly completed
3.2. Spacecraft
 The spacecraft is responsible for all communications, power
generation, and attitude control for the satellite. In the interest of
cost and schedule savings, the FUSE project procured the
spacecraft from a commercial vendor. Orbital Sciences
Corporation delivered the spacecraft to APL in March, 1998.
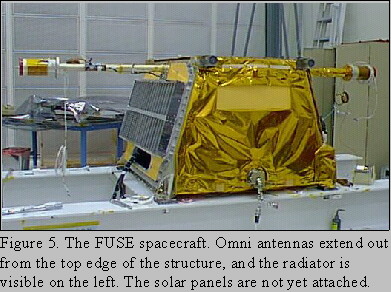
Figure 5 shows a photograph of the spacecraft under construction
at OSC.
The spacecraft is responsible for all communications, power
generation, and attitude control for the satellite. In the interest of
cost and schedule savings, the FUSE project procured the
spacecraft from a commercial vendor. Orbital Sciences
Corporation delivered the spacecraft to APL in March, 1998.
Figure 5 shows a photograph of the spacecraft under construction
at OSC.
Pointing stability (with fine pointing data from the FES) is
expected to be better than the 0.5 arcsecond, 1 requirement. A
closed loop pointing test, which includes all the components of the
pointing system except the FES, is scheduled for late April. The
pointing is important in order to ensure maximum effective area
when using one of narrow slits; it also ensures maximum
resolution when using a wider slit.
3.3. Ground station
 Communication to FUSE will be through a single, dedicated
ground station located at the University of Puerto Rico
-Mayaguez. During a typical day, there will be approximately
seven contact periods of 10 - 12 minutes each, and an interval of
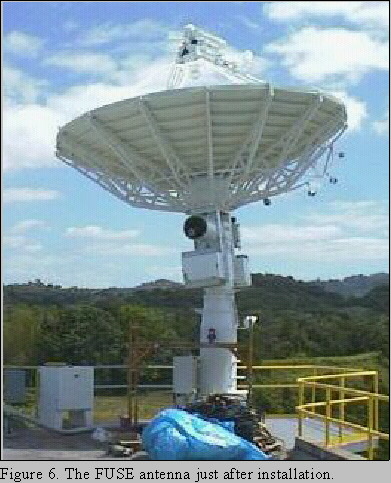
up to twelve hours with no contact. Figure 6 shows the FUSE
antenna in March, 1998, just after installation.
Communication to FUSE will be through a single, dedicated
ground station located at the University of Puerto Rico
-Mayaguez. During a typical day, there will be approximately
seven contact periods of 10 - 12 minutes each, and an interval of
up to twelve hours with no contact. Figure 6 shows the FUSE
antenna in March, 1998, just after installation.
3.4. Mission operations
Science and mission operations for FUSE will be conducted from
the Spacecraft Control Center at JHU. Because of the limited
contact with the ground station, observations will be pre-planned
and uploaded to the spacecraft. A high degree of autonomy has
been built into the instrument in order to allow unaided target
acquisition and health and safety checks.
FUSE data will be processed in a modified version of the pipeline
used for the reduction of data from the Hubble Space Telescope.
The standard product of the reduction process will be extracted,
calibrated, one-dimensional spectra instead of the complex two-dimensional data collected by the detector. The FUSE science data
will be passed through a processing "pipeline" in order to extract the one-dimensional spectra. This pipeline will correct for
instrumental and observational effects, and provide wavelength and flux calibration. The data must then be output in a form that
is compatible with standard astronomical software packages. Development of this automated process in well under way, and
individual steps of the process are being tested on both simulated and real data.
The data will be permanently archived at the Space Telescope Science Institute. After a six month proprietary period, it will
become publicly available.
3.5. Integration and test
After optical alignment and electronics integration, followed by integration of the spacecraft to the instrument, an extensive period
of environmental testing, including comprehensive testing in a thermal vacuum chamber, will be done at the Goddard Space Flight
Center. During that test, the satellite will be operated under conditions as close as possible to those on-orbit. The four mirrors
will be illuminated with ultraviolet light (although a windowed Pt/Ne lamp will only produce wavelengths above ~1025 Å).
Spectra will be collected, the flight mechanisms will be activated, and many of the on-orbit procedures will be exercised.
4. PREDICTED PERFORMANCE
The unique properties of FUSE for doing FUV spectroscopy depend primarily on its high effective area and high resolving power.
Although a full characterization of these will not be known until the satellite is in orbit, preliminary estimates can be made before
then. Discussed below are the maximum effective area and resolving power that can be achieved. Tradeoffs inherent in the design
preclude maximizing both simultaneously.
4.1. Effective area
The reflectivity of the mirrors and gratings was measured at the time each was coated. Since then, witness samples which were
coated simultaneously have been measured periodically in order to monitor the change in reflectivity. We expect that the
reflectivity (particularly that of the LiF coatings) will decrease with time as the amount of exposure to humidity and contaminants
increases. The witness sample program will continue through launch. In flight, photometric response will be determined and
monitored by fitting models to the observed spectra of hot DA white dwarfs.
The groove efficiency of each diffraction gratings was measured by Laboratoire Astronomie Spatiale (LAS) after manufacture
by Jobin Yvon. The grating efficiency, which is the product of groove efficiency and reflectivity, was also measured for each
grating at the University of Colorado. Detector quantum
efficiency (see section 3.1.4) for each of the four detector
segments was measured at UC Berkeley before the detectors
were delivered to spectrograph I&T.
These measurements, combined with the expected
degradation due to further exposure of the optics, gives the
expected beginning of life effective area shown in Figure 7.
Shown is the sum of effective area from all four channels.
Due to the gaps between channels, the varying number of
channels at each wavelength, and the changes in detector
quantum efficiency, groove efficiency and reflectivity with
wavelength, the shape of the curve is quite complex. The total
wavelength coverage is 905 to 1187 Å. All wavelengths
between 917 and 1181 Å are covered by at least two
channels; most of the 987 to 1091 Å range is covered by all
four channels simultaneously.
 This figure shows the expected effective area at launch
through the largest aperture, which is expected to pass close
to 100% of the light reflected by the mirrors. Choosing one of the smaller apertures, which may improve the resolving power
(depending on the source, the on-orbit point spread function of the mirrors, and the spacecraft pointing jitter), will decrease these
numbers by up to 35%. In addition, we expect a degradation of up to 20% per year on orbit, based on the experience of other
ultraviolet missions. We expect that the absolute calibration will be good to 10% on orbit.
This figure shows the expected effective area at launch
through the largest aperture, which is expected to pass close
to 100% of the light reflected by the mirrors. Choosing one of the smaller apertures, which may improve the resolving power
(depending on the source, the on-orbit point spread function of the mirrors, and the spacecraft pointing jitter), will decrease these
numbers by up to 35%. In addition, we expect a degradation of up to 20% per year on orbit, based on the experience of other
ultraviolet missions. We expect that the absolute calibration will be good to 10% on orbit.
It is important to remember that the entire wavelength region shown in the effective area plot is captured simultaneously. This
was not the case with Copernicus, for example, which required scanning of the detector, covering one 0.05 Å spectral resolution
element at a time, in order to cover the entire wavelength range. Similarly, some instruments on the Hubble Space Telescope have
multiple gratings; choosing a grating also determines the wavelength coverage. For FUSE, all four channels will be used
simultaneously for nearly all observations.
The expected effective area should allow observations of objects as faint as 2 10-14 erg cm-2 s-1 Å-1 at 1050 Å with a signal to
noise ratio of 15 in 140,000 seconds. Since FUSE is optimized for faint objects such as these, it will be difficult to observe targets
with fluxes greater than 10-10 erg cm-2 s-1 Å-1 in one of the three calibrated apertures without the possibility of damaging the
detector. Initially, any observations of objects brighter than this will not be photometrically calibrated, and may not be allowed
at all.
4.2. Resolving power
 During spectrograph integration and test, hundreds of spectra
were taken in order to align and characterize the spectrograph
(section 3.1.3). During those tests, the flight telescope mirrors
were simulated by a folded optical system which did not perform
as well as the flight mirrors will. In addition, other effects such as
pointing jitter and distortion of the structure due to thermal
variations on-orbit were not present. As a result, the data obtained
do not directly reflect the expected flight performance, but, when
combined with modeling, they can be used to predict the resolving
power. This analysis has only just begun.
During spectrograph integration and test, hundreds of spectra
were taken in order to align and characterize the spectrograph
(section 3.1.3). During those tests, the flight telescope mirrors
were simulated by a folded optical system which did not perform
as well as the flight mirrors will. In addition, other effects such as
pointing jitter and distortion of the structure due to thermal
variations on-orbit were not present. As a result, the data obtained
do not directly reflect the expected flight performance, but, when
combined with modeling, they can be used to predict the resolving
power. This analysis has only just begun.
Figure 8 shows the current estimate of resolving power for each
channel separately. The data shown were calculated by measuring
the widths of several spectral lines in each channel using H2
spectra obtained during spectrograph I&T. Because of the
uncertainties in choosing these lines and the fact that this analysis
has just begun, the numbers should be considered preliminary.
Changes in detector performance with position (particularly at the
ends of each segment) are responsible for some of the variations within a given detector segment, as are variations in the intrinsic
widths of the lines chosen for the plot. We plan to measure the spectrum of the H2 lamp independently in the future in order to
help identify the narrowest lines.
5. ADDITIONAL INFORMATION
FUSE will have a substantial guest investigator program which will allow astronomers from around the world to make use of
this unique device. The NASA Research Announcement (NRA 98-OSS-02) inviting proposals for Cycle 1 has been released,
and proposals are due on May 8, 1998.
6. ACKNOWLEDGEMENTS
This work was supported by NASA contract NAS5-32985.
7. REFERENCES
1. J. C. Green, E. Wilkinson, and S. D. Friedman, "The design of the Far Ultraviolet Spectroscopic Explorer
spectrograph," Proc. SPIE 2283, pp. 12-19, 1994.
2. D. J. Sahnow, S. D. Friedman, W. R. Oegerle, H. W. Moos, J. C. Green, and O. H. W. Seigmund, "Design and
predicted performance of the Far Ultraviolet Spectroscopic Explorer (FUSE)," Proc. SPIE 2807, pp. 2-10, 1996.
3. R. G. Ohl, R. H. Barkhouser, M. J. Kennedy, and S. D. Friedman, "Assembly and test-induced distortions of
FUSE mirrors - lessons learned," Proc. SPIE 3356, 1998.
4. E. Wilkinson, J. C. Green, S. N. Osterman, K. R. Brownsberger, and D. J. Sahnow, "Integration, alignment and
performance results of the Far Ultraviolet Explorer (FUSE) spectrograph," Proc. SPIE 3356, 1998.
5. O. H. W. Siegmund, M. Gummin, G. Gaines, G. Naletto, J. Stock, R. Raffanti, J. Hull, R. Abiad, T.
Rodriguez-Bell, T. Magoncelli, P. Jelinsky, W. Donakowski, and K. Kromer, "Performance of the double delay line
microchannel plate detectors for the Far Ultraviolet Spectroscopic Explorer," Proc. SPIE 3114, pp. 283-294, 1997.