 |
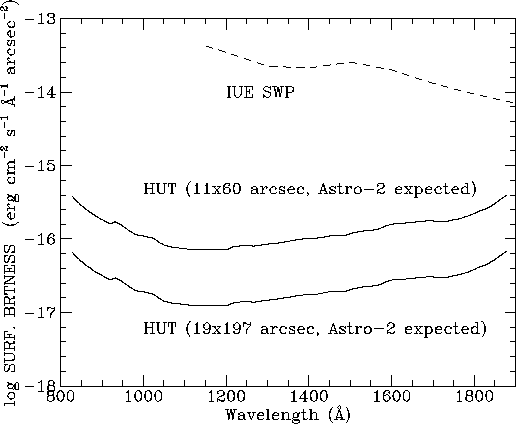 |
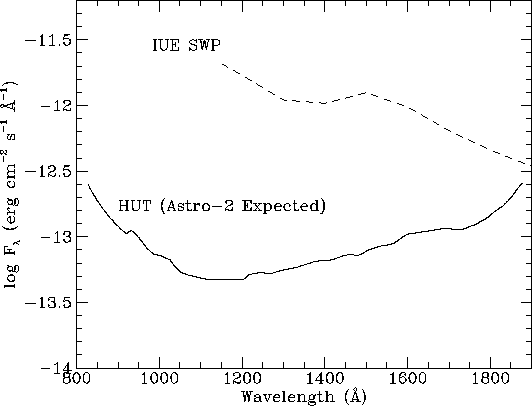
Using the calibration information presented in the previous section, we now discuss estimating the feasibility of a variety of possible science observations using HUT. Quick estimates of expected signal-to-noise ratios (S/N) can be made using the sensitivity curves presented in Figures 5-1 and 5-2. These show the continuum flux or surface brightness required to achieve a S/N ratio of 10 per Å in a single 1800 s observation for a point source and for extended sources which fill the long slits. For comparison we show similar sensitivity curves for IUE observations using the SWP camera and the large aperture.
 |
 |
More detailed estimates can be made using the following procedures.
For a continuum source, the number of detected counts per ![]() 0.5 Å pixel
can be estimated using the anticipated effective area curve presented in
Figure 5-4 and the relation
0.5 Å pixel
can be estimated using the anticipated effective area curve presented in
Figure 5-4 and the relation
| (1) |
where ![]() is in
is in ![]() ,
, ![]() is
the effective area (from Figures 4-5, 4-6, or 4-7),
is
the effective area (from Figures 4-5, 4-6, or 4-7), ![]() is the
integration time (typically 1800 s for a single pointing), and
is the
integration time (typically 1800 s for a single pointing), and
![]() 0.51336 Å for first order, or 0.25668 Å for
second order.
0.51336 Å for first order, or 0.25668 Å for
second order.
For an extended source, one must use the surface brightness for ![]() in
in
![]() Å
Å![]() and the angular
size
and the angular
size ![]() of either the slit or the source, whichever is smaller,
as in
of either the slit or the source, whichever is smaller,
as in
| (2) |
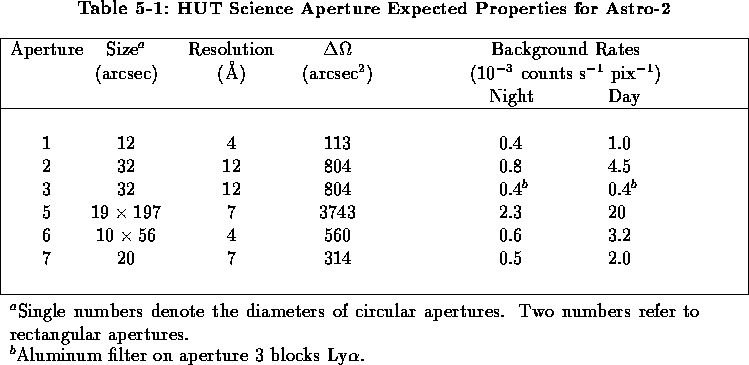
The angular areas of the HUT slits are given in Table 5-1.
=-2 Count rates for continuum sources must be less than 2.5 counts s-1 pixel-1 and less than 40 counts s-1 pixel-1 at the peaks of isolated emission lines. For sources with rates in excess of these values, the full aperture of the telescope must be stopped down. Closing one door gives a reduction of a factor of two. The 50 cm2 small aperture door gives a reduction of a factor of 102, and the 1 cm2 small aperture door gives a reduction of a factor of 5120. (Use of the 1 cm2 small aperture door requires special procedures to avoid undue pressure buildup in the telescope and spectrograph due to outgassing. Use of this door state should be avoided if possible.)
To evaluate the signal-to-noise ratio (S/N) for a specific observation,
one must also take the background into account.
The dark count due to charged particle
events is quite low, but scattered light from geocoronal Ly![]() makes a
significant contribution to the general background, particularly during orbital
day or if large apertures are chosen. For a continuum point source the S/N is
given by
makes a
significant contribution to the general background, particularly during orbital
day or if large apertures are chosen. For a continuum point source the S/N is
given by
 |
(3) |
where ![]() is the background rate per pixel and
is the background rate per pixel and ![]() is the number
of pixels.
Table 5-1 also shows the
anticipated background rates due to dark counts plus scattered light in each
of the HUT science apertures for both orbital day and orbital night.
We assume a geocoronal Ly
is the number
of pixels.
Table 5-1 also shows the
anticipated background rates due to dark counts plus scattered light in each
of the HUT science apertures for both orbital day and orbital night.
We assume a geocoronal Ly![]() intensity of 2 kR (1 Rayleigh
intensity of 2 kR (1 Rayleigh
![]() ) during night, and
20 kR during day though the actual values will differ and also depend on the
shuttle orbital position and the pointing direction.
These are conservative estimates based a flight near solar
minimum using the models of Meier (1991).
) during night, and
20 kR during day though the actual values will differ and also depend on the
shuttle orbital position and the pointing direction.
These are conservative estimates based a flight near solar
minimum using the models of Meier (1991).
Discrete airglow lines also substantially
increase the background in their immediate vicinity, especially during
orbital day.
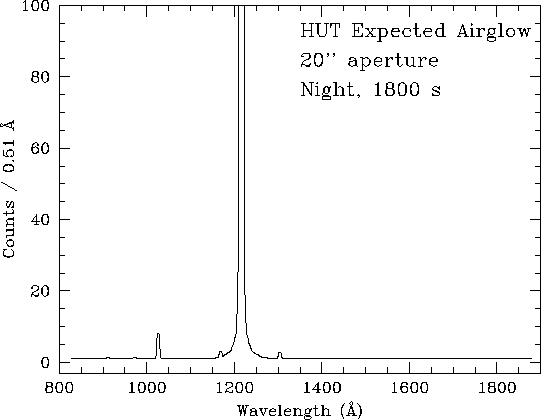
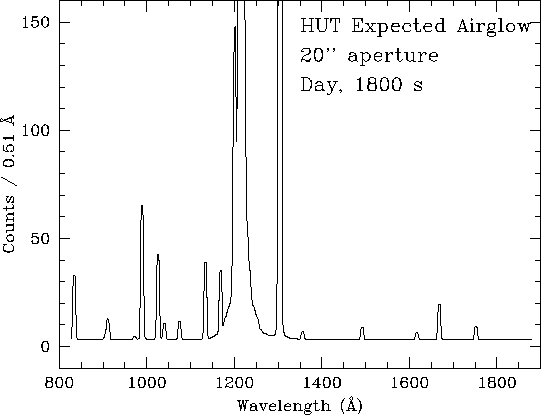
Typical airglow spectra for an 1800 s observation using the 20![]() aperture are shown in
Figures 5-3 and 5-4 for orbital night and orbital day, respectively.
Both spectra have been truncated to show the fainter features.
In the night spectrum, Ly
aperture are shown in
Figures 5-3 and 5-4 for orbital night and orbital day, respectively.
Both spectra have been truncated to show the fainter features.
In the night spectrum, Ly![]() peaks off scale at 4500 counts pix-1.
In the day spectrum Ly
peaks off scale at 4500 counts pix-1.
In the day spectrum Ly![]() is off scale
at 37,700 counts pix-1, and O I
is off scale
at 37,700 counts pix-1, and O I ![]() 1304 peaks at 1100 counts pix-1.
Again, these estimates are based on Meier's (1991) models near solar minimum.
1304 peaks at 1100 counts pix-1.
Again, these estimates are based on Meier's (1991) models near solar minimum.
While orbital night clearly offers advantages, about half the scheduled observations must take place during orbital day. To reserve the lower background of orbital night for the fainter targets, bright point source observations are normally done during the day.
 |
 |
Simulated HUT data for a wide variety of input source spectra can be generated with the HUT simulator hutsim, which is a task in the hut package in IRAF. The following instructions will enable a user to acquire and install a local version of the hut package. These instructions are not for a system-wide installation. Rather, the individual user obtains his/her own copy of the programs and files via anonymous ftp. Once installed, the package is not visible when starting up IRAF, but it can be loaded by typing its name, hut.
To install the IRAF package hut containing the hutsim tasks, take the following steps:
>ftp hut4.pha.jhu.edu OR
>ftp 128.220.26.36
ftp> cd hutsim
ftp> binary
ftp> get hutsim.tar
ftp> quit
>cl
cl> softools
so> rtar -xvf hutsim.tar
so> bye
cl> page README.cl
cl> help hut$src/doc/hutsim.hlp file+ page- | lpr
(This special procedure is necessary since the help files for the hut package are not installed in the system-wide IRAF help database.)