Princeton, New Jersey
April 11, 1975
| TO: | Copernicus Astronomers and Guest Investigators |
| FROM: | Edward B . Jenkins |
| SUBJECT: | Computations of the U1 Instrumental Profile |

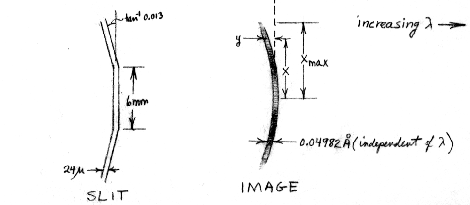
Note that the brightness of the image varies along its length; this is caused by uneven illumination of the grating. Occultation by the spectrometer and secondary spider casts a shadow on the grating which produces an intensity distribution
| |x/xmax| | 0.0 | 0.1 | 0.2 | 0.3 | 0.4 | 0.5 | 0.6 | 0.7 | 0.8 | 0.9 | 1.0 |
| I(x) | 0.00 | 0.30 | 0.29 | 0.28 | 0.88 | 0.83 | 0.76 | 0.67 | 0.55 | 0.40 | 0.10 |
If R is the radius of curvature of the grating (and the diameter of the Rowland circle; this value is 998.8 mm), the height L of the illumination on the grating is R(cos i)/20 for an f/20 beam with an angle of incidence i. The astigmatic image height is given by
where Gamma = sin2 r + sin i tan i cos r (r is the angle of diffraction). The curvature of this image follows the relation2xmax = L Gamma
wherey = -Psi x2/2R
Psi = [sin i tan2i - sin r + {tan r(1- Gamma)2}/cos r] Gamma-2
For most wavelengths along the spectrum the segmented slit compensates for the curve. To ascertain the small smearing which results from the lack of a perfect match, we may define an offset
andy'(x) = y(x) for |x| <= 3.0 mm
If the entrance and exit slits had infinitesimal widths, we would expect an instrumental profile whose shape follows the functiony'(x) = y(x) - 0.013(|x| - 3.0 mm) for |x| > 3.0 mm
where the sum includes all points along the line from 0 to xmax where the function crosses y'. The conversion from y' to Delta Lambda is given byP(y') = Sum (dy'/dx)-1I(x)
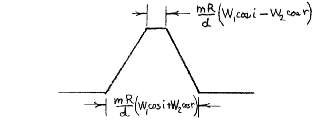
(m and d are the order and groove spacing, respectively). If one were to scan across any small piece of the curved image with the exit slit, one would expect to see the convolution of the two slits which results in a trapezoid,Delta Lambda = mR/d cos r y' = 2.0858 x 10³ cos r y' for y' in mm and Delta Lambda in mÅ
 |
mR/d W1cos
i = 49.82 mÅ (= FWHM1 at all Lambda) |
where W1 and W2 are the entrance and exit slit widths, respectively.
Although the face of the exit slit is always tangent to the Rowland circle, the effective width W2 varies slightly with wavelength since the light strikes the jaws at the diffraction angle r from the normal, and the jaws are not perfectly thin. The projected widths as seen from the grating W2 cos r has been measured by Perkin-Elmer and a functional fit to these data has been made by J. B. Rogerson.
A convolution of P(Delta Lambda) with the above shown trapezoid gives us the net instrumental profile, which includes the slit widths and the small lack of registration of exit slit shape with the image curvature. Some additional smearing should be caused by spherical aberration, giving an image diameter
A =L3/(8R2) (sin i tan i + sin r tan r) cos r
which may be multiplied by 2.0858 x 10³ cos r to give the value in mÅ. The above figure, however, is appropriate at the paraxial focus. The aberration may be substantially reduced (by about a factor of four, I am told), by viewing the line at the circle of least confusion, instead of the paraxial focus.
where Phi = (sin i + sin r)/cos2r. For the Copernicus spectrometer actual values of re are several times larger than the radius of curvature of the image R/Psi defined earlier. The net instrumental profile for a diffuse source can be evaluated by adding together the profiles for many single point sources arranged along the entrance slit.re = R/Phi
It is of interest to compare the computed curves with actual observations in orbit. Two sources of information are available at present. First, W. Morton and L. Spitzer have measured stacked profiles of H2 lines which are presumed to be quite narrow. They find a good fit for the region 1025 <~ Lambda <~ 1100 Å is a gaussian profile with a FWHM = 51 mÅ. This relation is plotted as a series of dots on the 1050 Å graph, and it is evident that no really significant source of additional smearing is at work in the spectrograph, except possibly in the wings beyond | Delta Lambda | = 40 mÅ. The other main source of observational material is the stack of geocoronal Lyman Alpha emission scans. Here, however, the emission profile is not so much smaller than the instrumental profile that we may ignore its effect in producing a slightly broader profile. In connection with research on the cometary Lyman Alpha observations, J. L. Bertaux has examined the geocoronal data and has also theoretically estimated the true Lyman Alpha profile shape. The observations give an approximately gaussian profile with FWHM = 67 mÅ while the emission profile is expected to be 38 mÅ wide. We therefore would expect to find the response of our instrument to a diffuse source of Lyman Alpha of infinitesimal width in Delta Lambda to be roughly a gaussian with FWHM = (672-382)½ = 55 mÅ. The computed curve at 1200 Å has FWHM = 60 mÅ; perhaps the geocoronal emission width was overestimated by Bertaux or else the difference may be attributable to the fact that the instrumental profile is not really a pure gaussian distribution.
Samson, J. A. 1967, Techniques of Vacuum Ultraviolet Spectroscopy (Wiley, New York) pp. 5-19.
Welford, W. T. 1965, in Progress in Optics 4 ed. by E. Wolf p. 243.