Hubble Source Catalog (HSC) Use Case # 1 - Point Source Photometry
Reference:- "Deep Optical Photometry of Six Fields in the Andromeda Galaxy"
BACKGROUND:
Brown et al. (2009) obtained deep optical images reaching well below
the oldest main sequence turnoff in six fields of the Andromeda Galaxy
using ACS. The fields are located at four positions on the southeast
minor axis, one position in the giant stellar stream, and one position
on the northeast major axis (disk). These data were obtained as part of
three large observing programs (9453, 10265, 10816) designed to probe
the star formation history of the stellar population in various
structures of the galaxy.
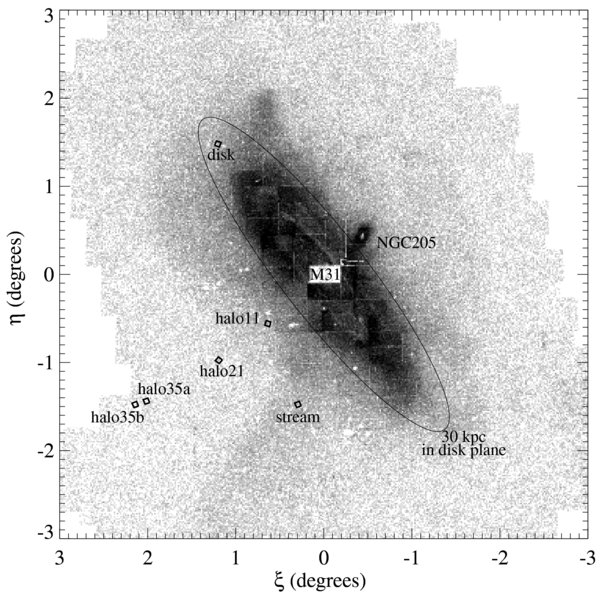
Left Fig. 1 (Brown et al. 2009; Reproduced by permission of the AAS): Shown is stellar
density in the Andromeda vicinity, from counts of RGB stars (Ferguson
et al. 2002) and fields studied by Brown et al.. Right Fig. 2 (Brown et
al. 2009; Reproduced by permission of the AAS) shows the CMD in the six studied fields.
USE CASE GOAL:
Construct the F606W - F814W vs F814W color magnitude
diagram (CMD) using the HSC and compare it with the disk field from
Brown et al. (2009).
NOTE: Several
steps below require the use of software external to the HSC
and HLA (e.g., to make calculations and plot data). This particular
document uses TOPCAT to make most of these figures. Other popular
analysis packages are PYRAF, IRAF, IDL, ... . Instructions for these
steps will necessarily be less specific than the earlier steps using
the HSC and HLA.
Part 1: View the Data
Note: If you use NumImages > 0 in the interactive display you will find
several blank sources. These are cosmic rays that have slipped through
the processing for one of the 27 images. You will find that the
decision of the criteria to use for NumImages is often one of the most
important decisions when using the HSC.
Note: You can view the abstract and papers that have resulted from the
10265
data set by clicking on the blue
10265
in the PropID column of the
inventory.
-
STEP 2-
Examine the HSC for the M31 disk field (i.e., similar to steps 8 - 9 of the "HSC Walkthrough").
Examine the HSC data for the M31 disk via the
HSC
using ‚"
Search with Summary Form".
Use the following criteria:
RA = 00:49:08.09
DEC = 42:44:55.0
Radius = 0.5 arcmin
Mag Type = MagAper2
NumImages > 1
The resulting search returns 537 rows. We can plot their
position by clicking on the "Display numeric columns graphically
using VOPlot", which appears near the top of the screen when using the
(default) html format to display the results from a HSC Summary form
search.
If you click on MatchID entries, you will see all the individual observations for that
object. For example MatchID 6390018 includes 28 different images.
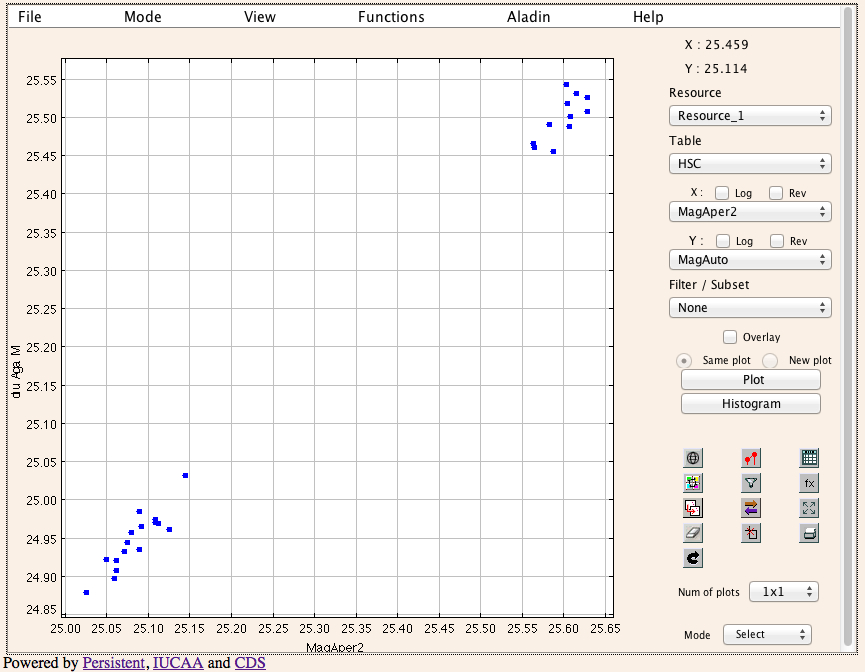
Display the properties of MatchID 6390018 by using VOPLOT:
-
plot MagAper2 vs MagAuto for the object with MatchID 6390018 -- Two clusters of points are shown, one for the F606W observations
(~25.5) and one for the F814W observations (~25.08). See the HLA help page
for a discussion of MagAuto and MagAper2.
-
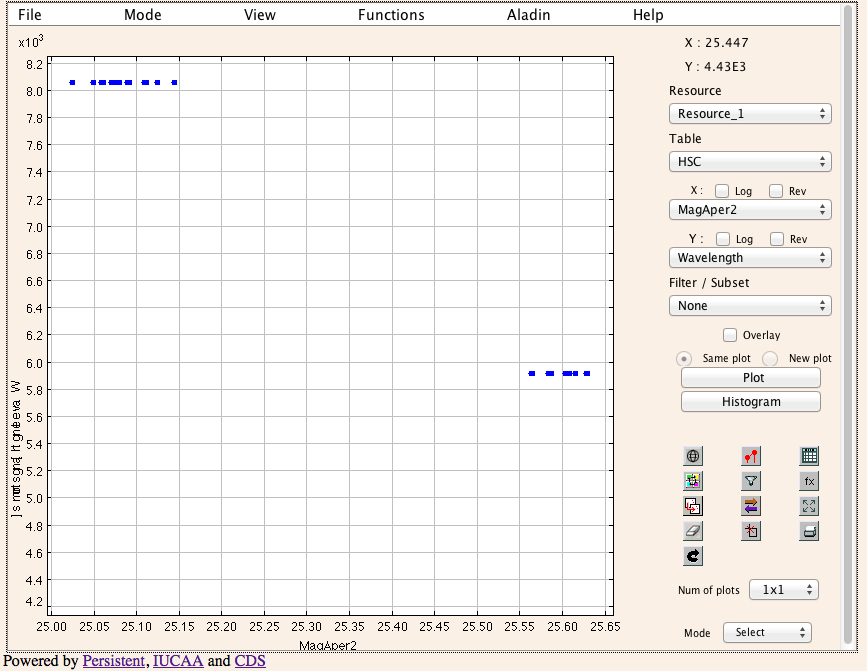
plot MagAper2 vs wavelength -- The different observations
for F606W and F814W are shown. This plot is also useful for
quickly showing the range of filters available for a given set of
observation.
-
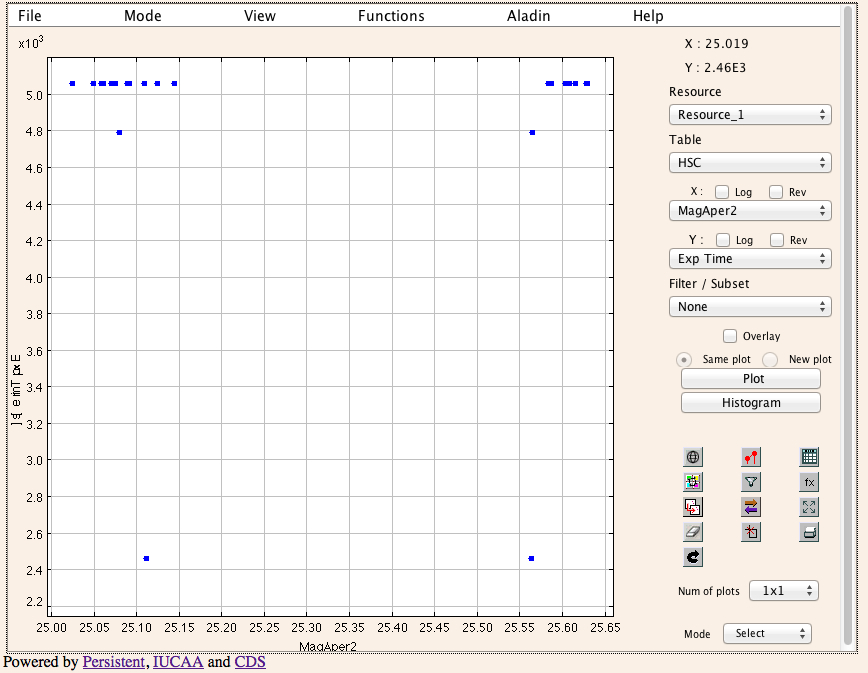
plot MagAper2 vs Exp Time -- The depth of each
individual observation that object MatchID 6390018 was calculated from
is shown, two of which have exposure times of 2460 seconds (taken from PI 10265 visits 21 and 22), two of which have
exposure times of 4790 seconds (taken from PI 10265 visits 11 and 12), and the
rest of which have deeper observations with exposure times of 5060 seconds (taken from different visits of PropID
10265).
Now make a wider search using the following criteria:
RA = 00:49:08.09
DEC =42:44:55.0
Radius = 2.5 arcmin
Mag Type = MagAper2
NumImages > 1
This will result in N=9053 objects that will be displayed in an html
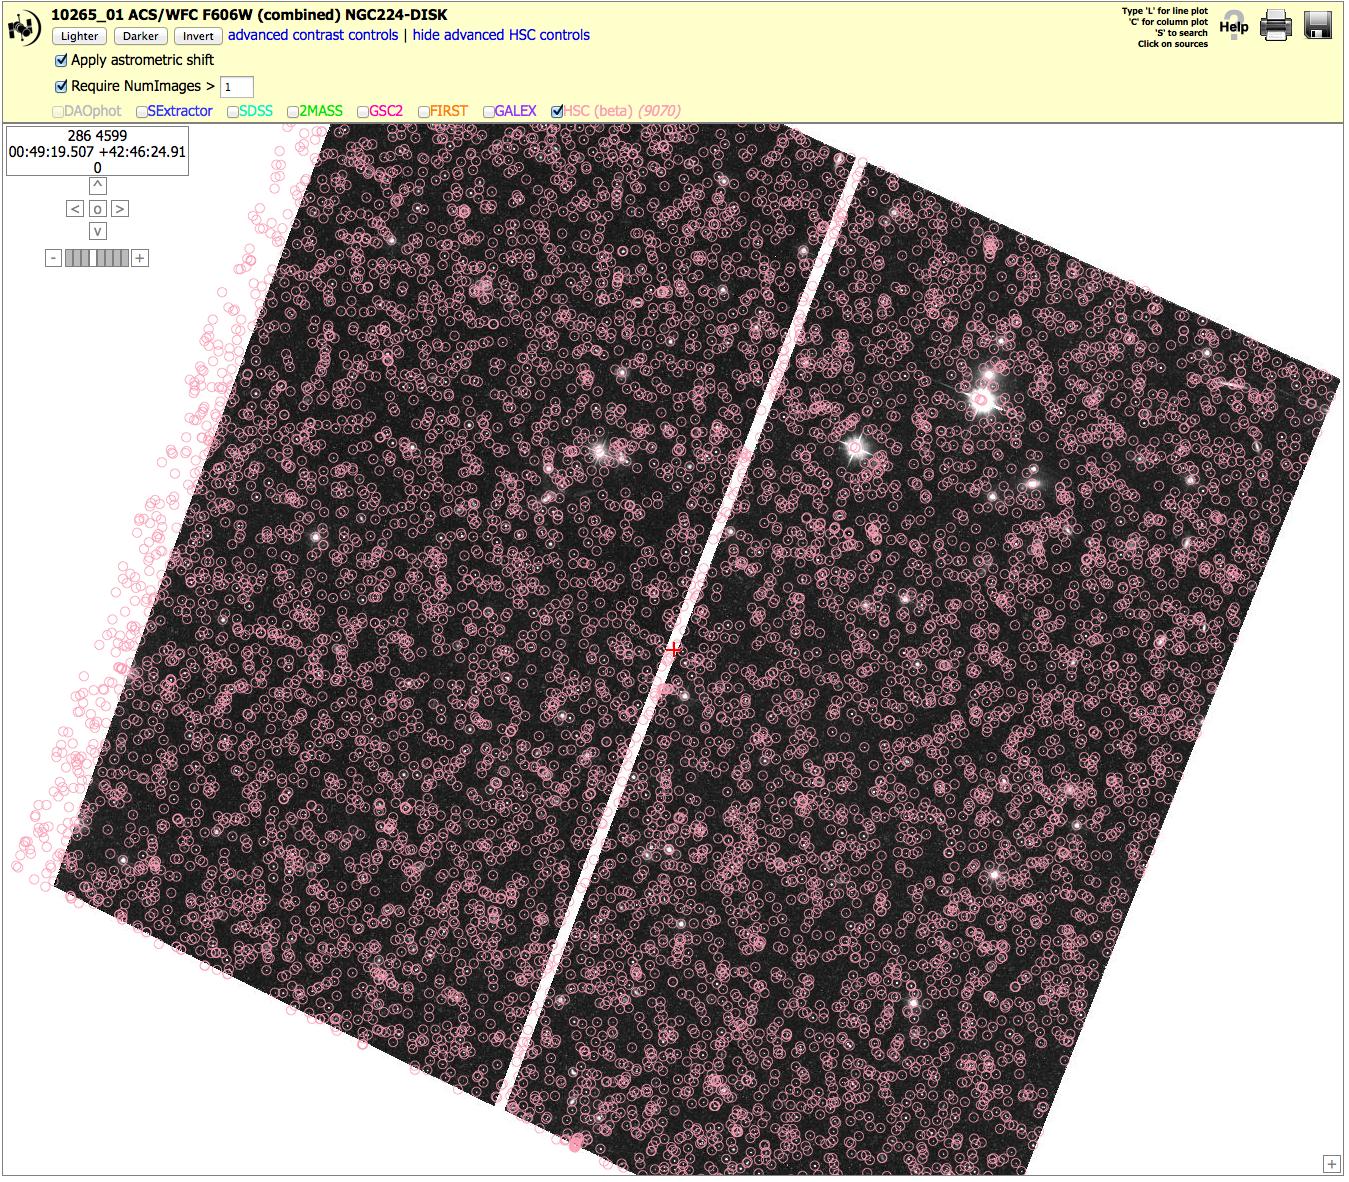
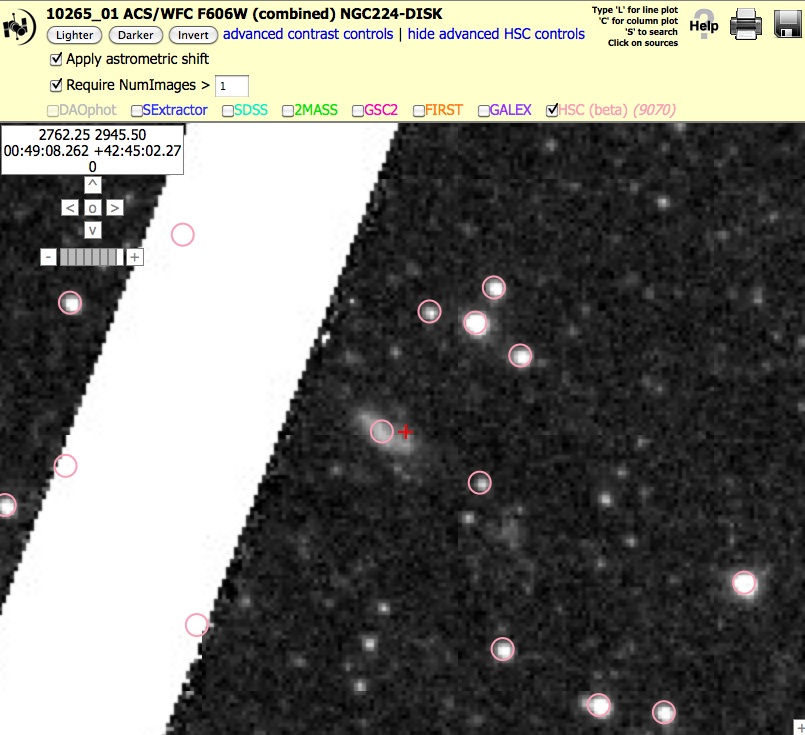
form. A visual inspection of the objects can be made by using the HLA Interactive Display.
Note
that in the figure below the HSC (beta) lists 9070 detected
objects since the HLA uses the
HSC Summary Search form
and looks around
the image center ra & dec with a Radius = 2.6 arcmin, Mag
Type=MagAuto, and NumImages >1.
Note that the first object in the list is MatchID = 6390018. It has 27
detections with mean A_F606W = 25.599 +/-0.022 and A_F814W = 25.084
+/-0.031. Note that the Concentration Index (CI; difference
between the 1 pix and 3 pix radius magnitudes) has a value CI = 1.102, which is
typical for a star.
If you look down the list you will find MatchID=6390123 has CI=2.106,
which is larger than expected for a star. If you look at the position
00:49:08.10 +42:44:59.04 on the interactive display you will find that,
indeed, this is a galaxy (i.e the object near the
+ in the image above).
If you click on the blue MatchID=6390018 in the first column of the
summary search form table you are taken to the detailed search form.
This shows that all 27 detections of this source are from program 10265. Hence this is a very uniform data set.
Part 2: Download and Trim the Data
-
STEP 3- Download the HSC catalog for the M31 disk field (i.e., similar to step 10 of the "HSC Walkthrough
using the Summary Search form").
Make a catalog to download by changing:
Maximum Records = 10001
Output Format = File: < your choice from the 8 options >
You may also want to change the output columns to customize your output (e.g., remove empty columns).
-
STEP 5-
Convert the photometric system Brown et al. (2009) used for the HLSP catalog to the AB system.
Brown et al. (2009) used DAOPhot (PSF fitting) and the STMAG
system for their catalog. They derive the following conversion
between the ABMAG system and the STMAG
system:
ABmag_F606W=STmag_F606W - 0.169
ABmag_F814W=STmag_F814W - 0.840
Note that Brown et al. also applied a CTE correction for their data.
For our star with match ID = 6390018 using MagAper2,
F606W = 25.599 and F814W = 25.084. The HSC uses the ABMAG system.
Hence converting from the HSC photometry system to the Brown system requires:
HSC F606W = 25.599 (ABMAG and no aperture correction)
+ 0.169 (ABMAG to STMAG)
- 0.248 aperture
correction (
Sirianni et al. 2005, Table 3, i.e. 2.5log[Encircled Energy]=2.5log[0.796])
------------
25.520 compared with Brown's 25.490 (so Delta = 0.030
with Brown brighter, probably because he corrects for CTE and the HSC
does not)
HSC F814W = 25.084
+0.840 (ABMAG to STMAG)
-0.292 aperture correction (
Sirianni et al. 2005, Table 3, i.e. 2.5log[Encircled Energy]=2.5log[0.764])
---------
25.632 compared with Brown's 25.60 (so Delta = 0.032)
-
STEP 6- Plot the position on the sky for both data set. (Please use your favorite analysis and plotting package such as python, IRAF, IDL, sm, pgplot,...)
Shown
in red is the Brown et al. Disk data set, and in blue the HSC. Note
that
the HSC provides all Sextractor objects including bright saturated
stars which
were removed by Brown et al.; in addition, Brown et al. excluded all
data along the image edges and the detector gap since the number of
available exposures in these area is smaller and hence the noise is larger.
-
STEP 7-
Trim to the higher quality HSC data.
Select
stars with errors in MagAper2 for both filters with values less than 0.2
and CI values in the range 1.0 - 1.3, typical of stars. After applying
this selection, the total number of stars is 7649.
Part 3: Compare the Data
-
STEP 8- Visual inspection using ds9.
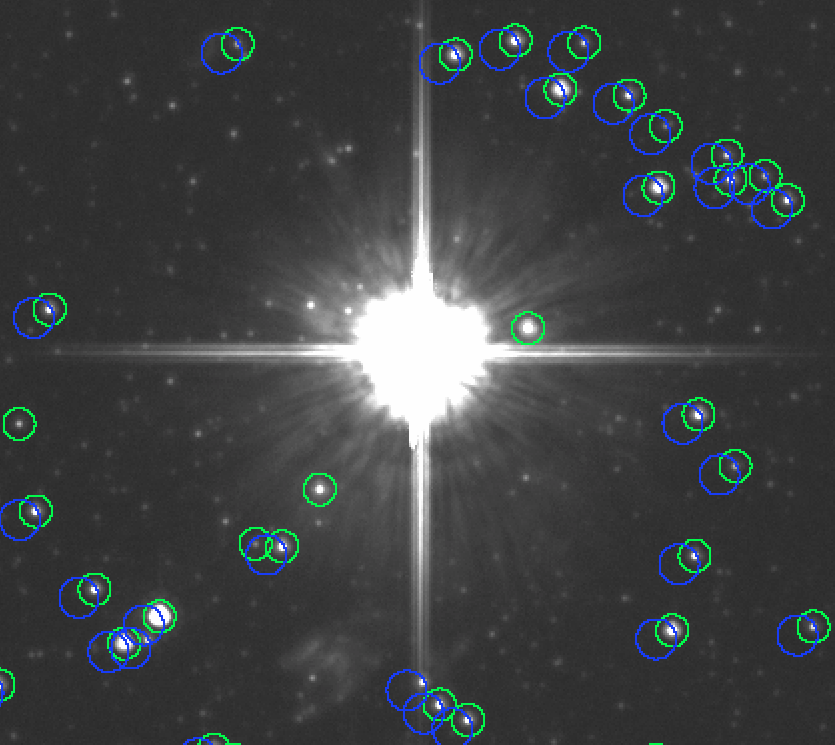
The figure above shows a comparison between the Brown et al. catalog (green
circles) and the HSC catalog (blue circles – before the correction has been made to match positions). While the
correspondence is in general very good, a few bright objects are
missing from the HSC in the immediate vicinity of very bright stars.
-
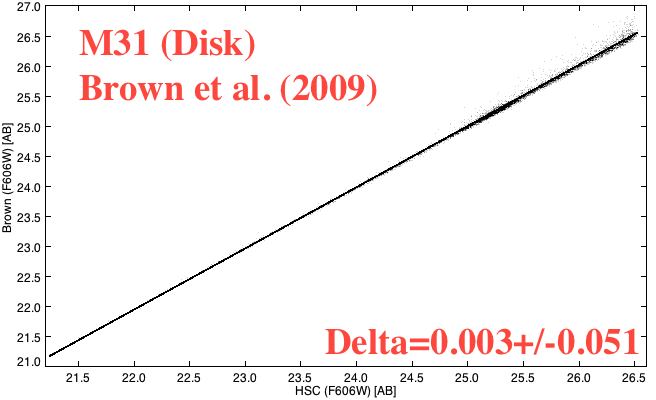
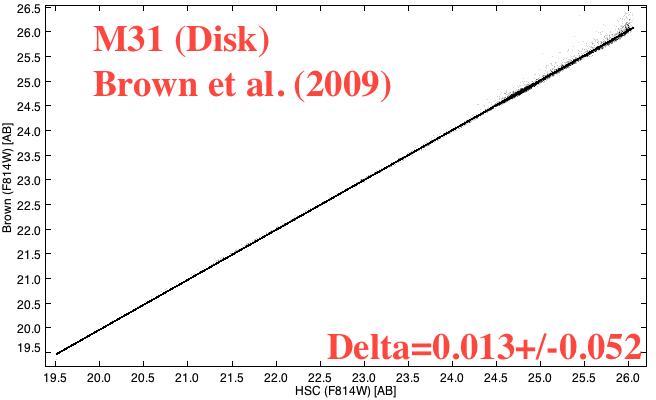
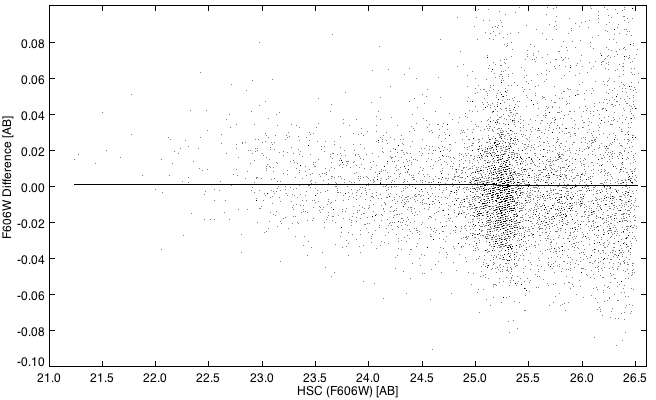
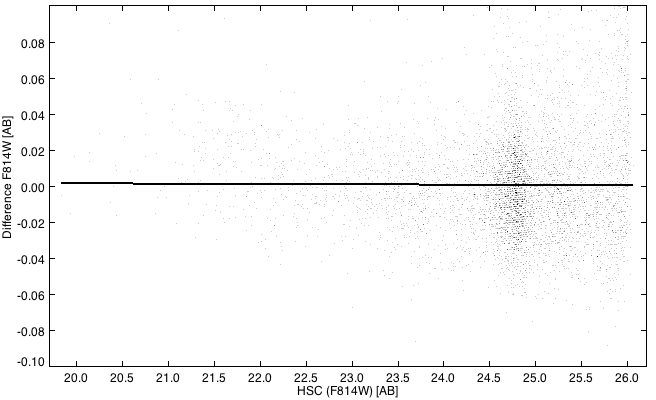
STEP 9- Match sources and compare photometry.
-
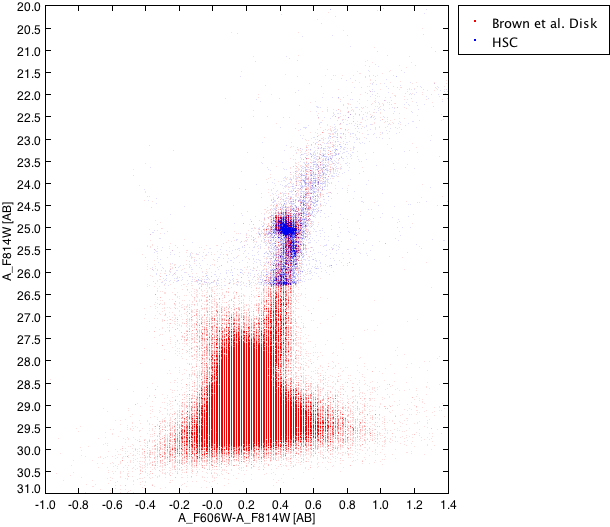
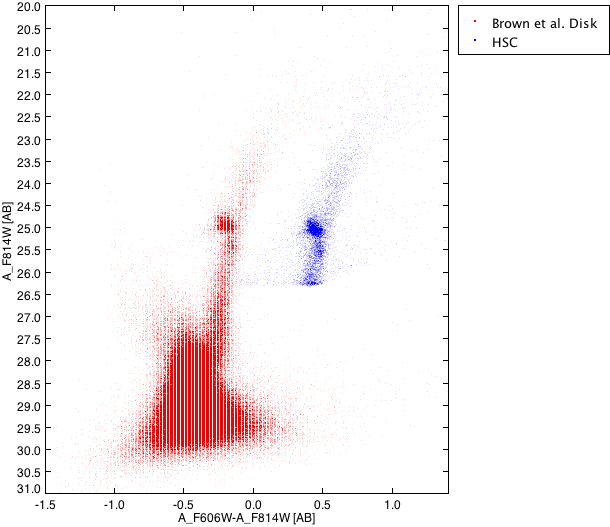
STEP 10-
Create and compare the CMD (i.e plot of F606W-F814W vs. F814W).
Plot
the CMDs for both data sets. HSC data are shown in blue
and Brown et al. data in red. The right figure shows the data in the AB mag
system, and the left figure shows the HSC CMD shifted by 0.64 mag. to
enhance the visual comparison. We note that even the fine structure in
the "red clump" (AB_F814W~24.8) is very similar.
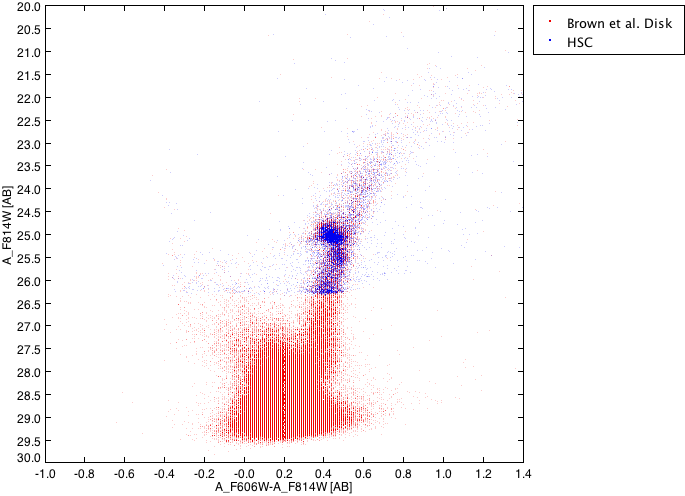
In general the comparison appears to be good, although there is slightly
more scatter in the HSC data set for fainter magnitudes. If you select
a subset of the data with magnitude errors for both filters <=0.01
mag, for F606W the Brown et al is deeper than the HSC by approximately 3 magnitudes, (see figure below) as
expected since this come from a mosaic where all 28 visits are co-added
compared to the HSC where the measurements are from each of the
individual visits. In addition, the HSC is not very aggressive, as
discussed in
FAQ.
-
The asymptotic giant branch (AGB) is the region of the CMD
populated by evolving low- to medium-mass stars (0.6–10 solar masses) late in their lives. Compare the AGB for
both data sets.
-
isolate the following regions in the CMD for both data sets:-
-
upper AGB = V-I = 0.2 to 0.8 and V = 24.0 - 24.2
-
lower AGB = V-I = 0.2 to 0.8 and V = 25.8 - 26.0
-
Now measure the standard deviation (std) of V-I, and
-
calculate the ratio HSC/Brown of std
-
We
find value of the ratio equal to 0.76 for the upper region (i.e. the
HSC is actually slightly narrower) and 1.78 for the lower region
(i.e. the HSC has more scatter at fainter magnitude as expected). Hence
the HSC can be used to study the AGB up to F606W ~26 [AB] mag.
-
STEP 11-
Calculate the completeness in magnitude assuming that Brown et al. (2009) catalog is "the truth".
-
Select all HSC
objects within the same sky coverage as Brown et al. (i.e
remove objects along the image edges and the detector gap).
-
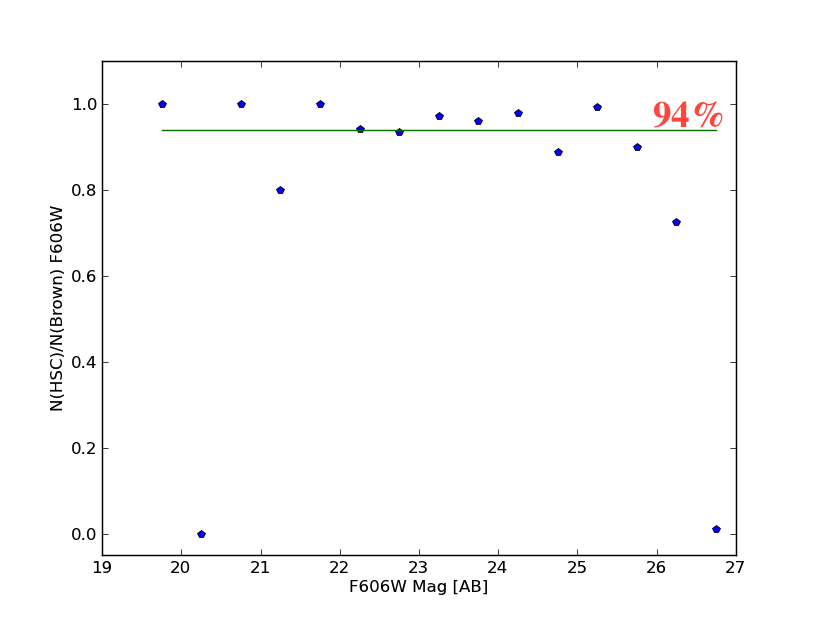
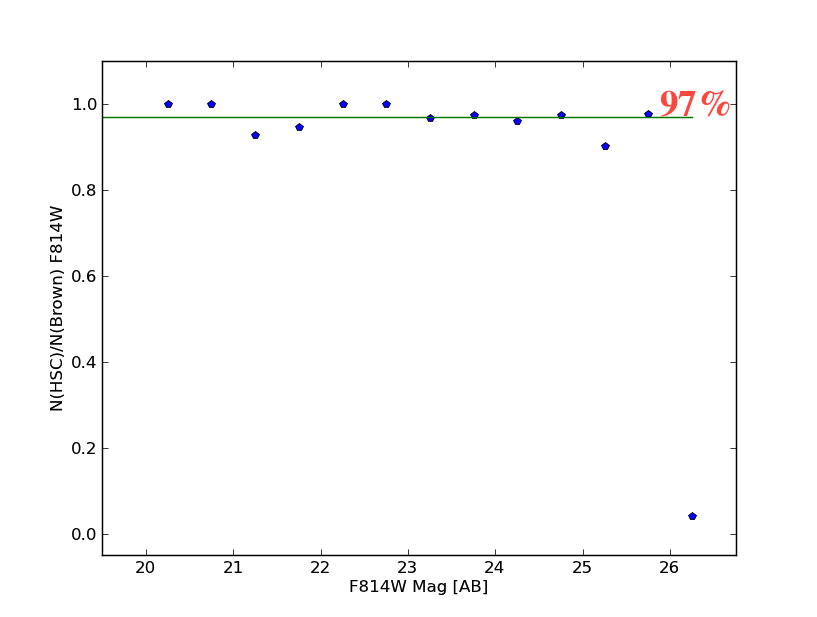
Plot the ratio between the number counts in the HSC
relative to the Brown et al. data set in 0.5 mag.
-
Shown below in blue is the distribution of the number
counts in the HSC
relative to the Brown et al. data set binned in 0.5mag. The right
figure shows the data for F606W and the left figure shows the data for
F814W. For both figures, the
horizontal green line indicates our adopted median value of
completeness estimated for
the
overlapping magnitude range above the completness threshold at ~26 mag.
Relative to the Brown et al. catalog of
photometrically classified stars the HSC completeness has a median
values of 94% for F606W and 97% for F814W.
CONCLUSIONS:
-
The HSC
Beta Version 0.2 catalog has been used to make a detailed comparison
with the stellar populations of the deeper Brown et al. (2009) data
set.
-
The HSC
and Brown et al. (2009) catalogs agree at about the 0.05 mag level out
to 26.5 ABmag in F606W and to 26 ABmag in F814W. The astrometric
difference between data sets is relatively small with
deltaRA=0.024 and deltaDec=0.6 arcsec.
-
Relative to the Brown et al. catalog, the HSC is completeness to ~94% for F606W and 97% for F814W.
-
The HSC Beta 0.2 catalog in this particular field does not go as
deep as the data would allow (e.g., the Brown et al. 2009 catalog), due
to the use of visit-based measurements in the HLA rather than
measurements in a deep mosaic where all the data has been combined (e.g. in
the Brown study - see FAQ).
-
NOTE: In the future, the HLA team is planning to produce deep
mosaic images for which Sextractor and DAOPhot catalogs will be
available for building the HSC.