
Other potential use cases could include testing cluster evolution via the change in the slope of the red sequence, and identifying other clusters with pronounced red sequences.
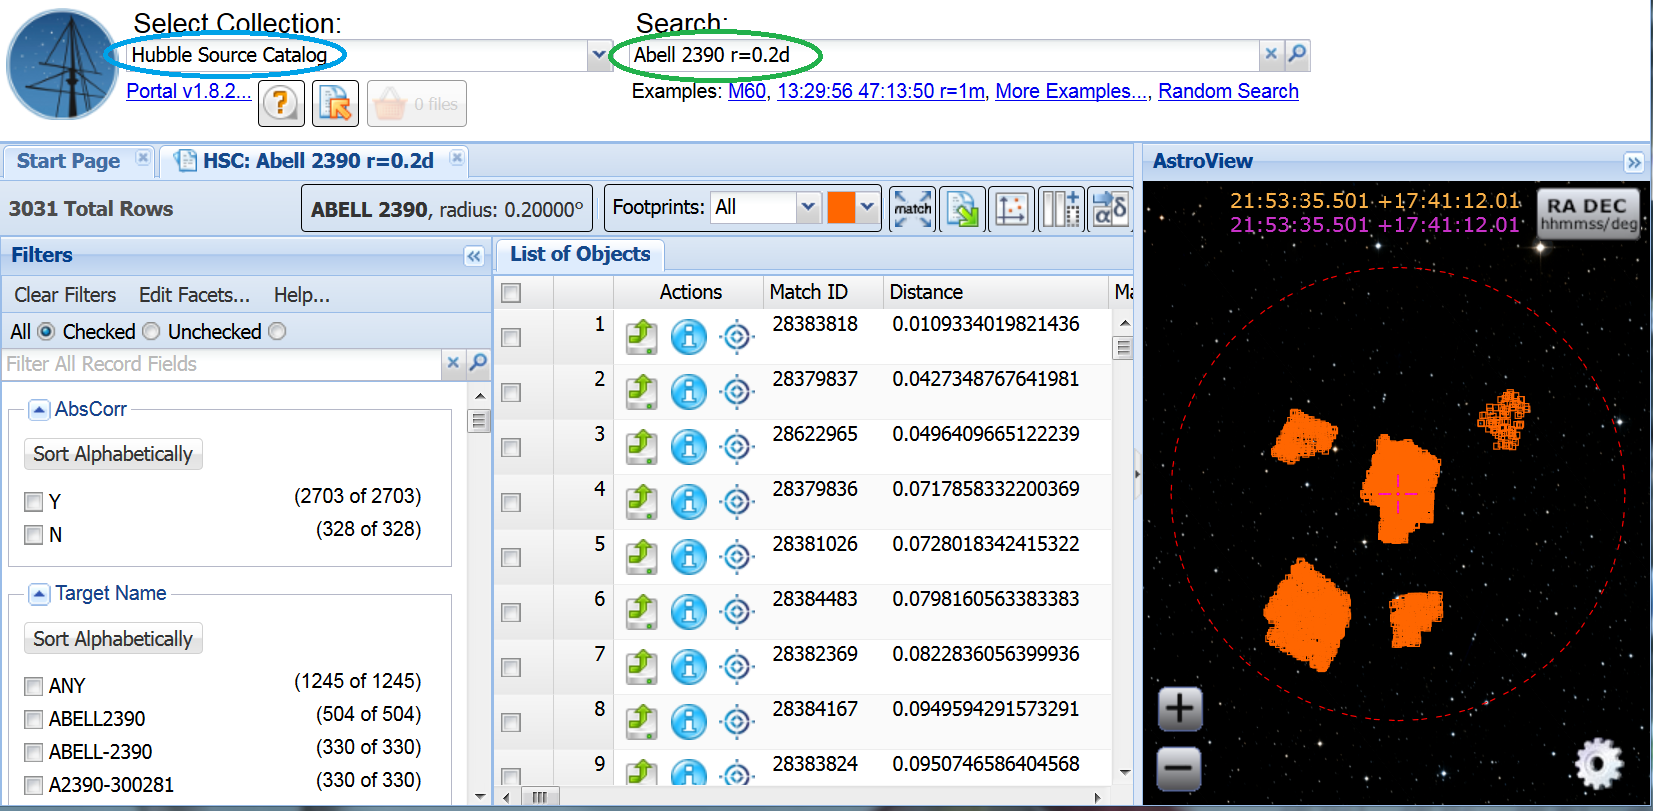
Use the pull down menu under Select Collection to choose the HSC (blue). Enter the name of the cluster (or if you prefer the coordinates) and search radius (i.e. Abell 2390 r=0.2d) in the Search box (green). Perform the search by just hitting a carriage return. The results are displayed in the List of Objects, while the AstroView window shows the objects against the DSS image. The left column is a series of Filters that can be used to refine the data selected.
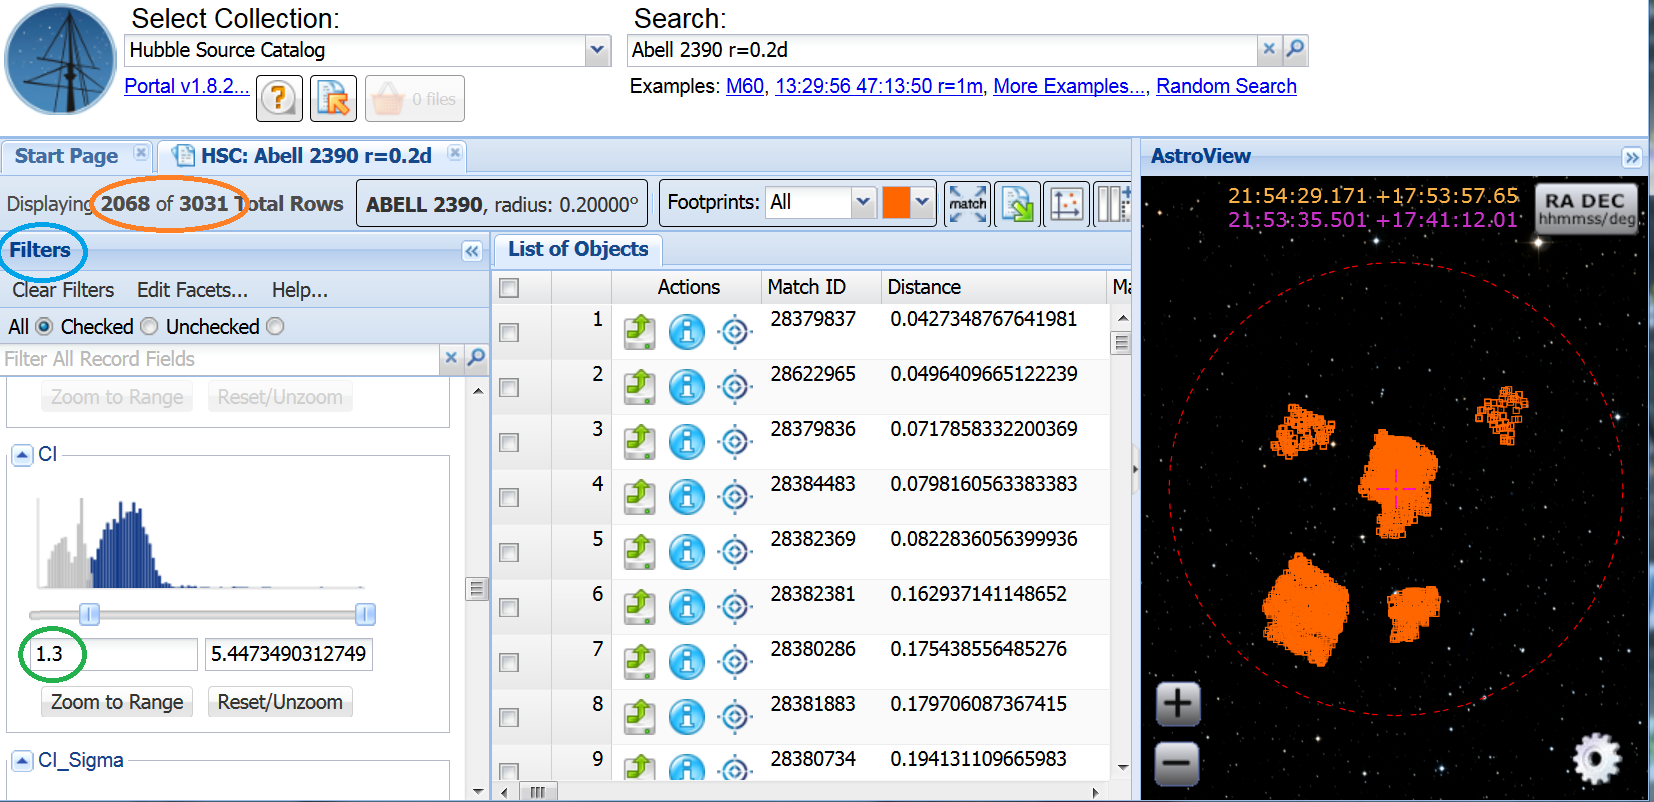
The HSC includes both compact (point) and extended sources, as well as a few residual cosmic rays and image artifacts. Since we are looking for galaxies (i.e. extended sources), we want to remove as many point sources as possible. Scroll down the Filters section (blue) to the CI (Concentration Index) area and set the lower limit to be 1.3 by either moving the slider or typing in the value (green). Note that about 1/3 of the objects have been rejected (orange).
To make our Color-Magnitude diagram, we need to correct the magnitude values for the V (W2_F555W = WFPC2 F555W) and I (W2_F814W = WFPC2 F814W) to infinite aperture magnitudes for better comparison, and correct for Galactic extinction along the line of sight.
Approximate aperture corrections can be taken from the aperture corrections table, or estimated from the encircled energy curves provided by the instrument teams. For both filters, the aperture corrections are 0.17 mag, or:
W2_F555W_Inf = W2_F555W - 0.17
W2_F814W_Inf = W2_F814W - 0.17.
Extinction correction is best estimated using an absorption calculator, like Doug's Excellent Absorption Law Calculator. The HSC table includes a column labeled Extinction, which is the Schlegel, Finkbeiner, & Davis 1998 (ApJ, 500, 525, 1998) E(B-V)=0.114 map value at that position. Using the absorption law calculator, with R_V = 3.1, and A_V = E(B-V) x R_V = 0.353, and assuming target wavelength equal to the pivot wavelength for each filter, or:
W_V = 0.535 (um)
W_I = 0.820 (um).
We get the following extinction corrections for each filter:
W2_F555W_Ext = W2_F555W - 0.36
W2_F814W_Ext = W2_F814W - 0.20,
and arrive at the final corrections for each filter:
W2_F555W_Cor = W2_F555W - 0.53
W2_F814W_Cor = W2_F814W - 0.37.
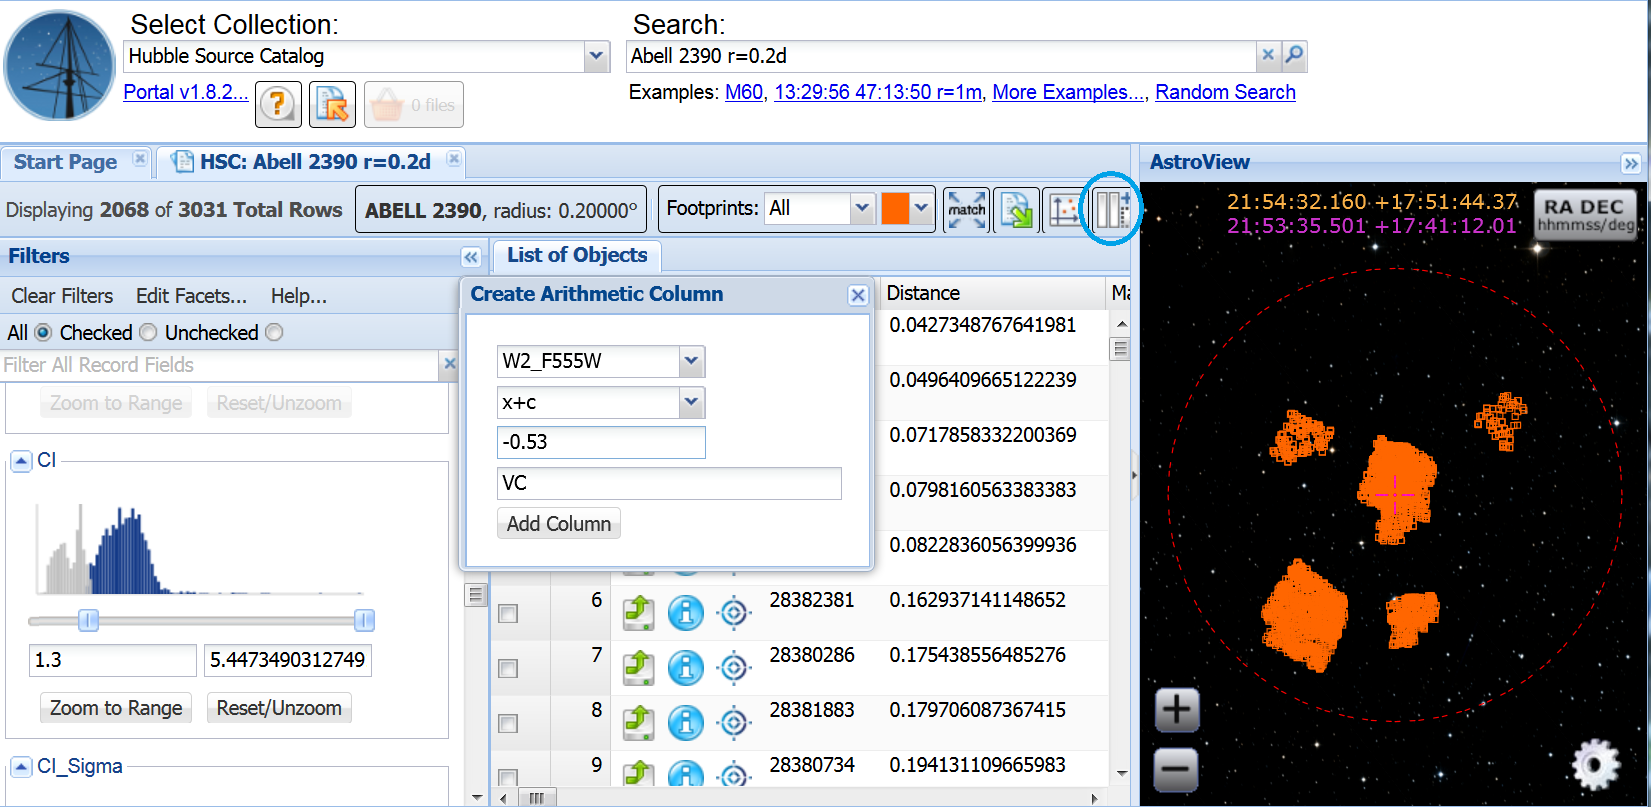
To correct the magnitudes, we will create new columns and apply the
corrections determined above. Click on the
 icon
(blue). In the popup, select the
first value to be "W2_F555W", the operation to be "x+c", and the
constant to be "-0.53"; enter the name as VC (V corrected).
Do the same thing to make the corrected W2_F814W (I) magnitude. Finally, we need to create the VC-IC color by selecting "VC", "-", "IC", and "VC-IC".
Select the  icon
(blue). Set X = IC and Y = VC-IC
(green). Click on the Update Series button
(orange) to plot the diagram.
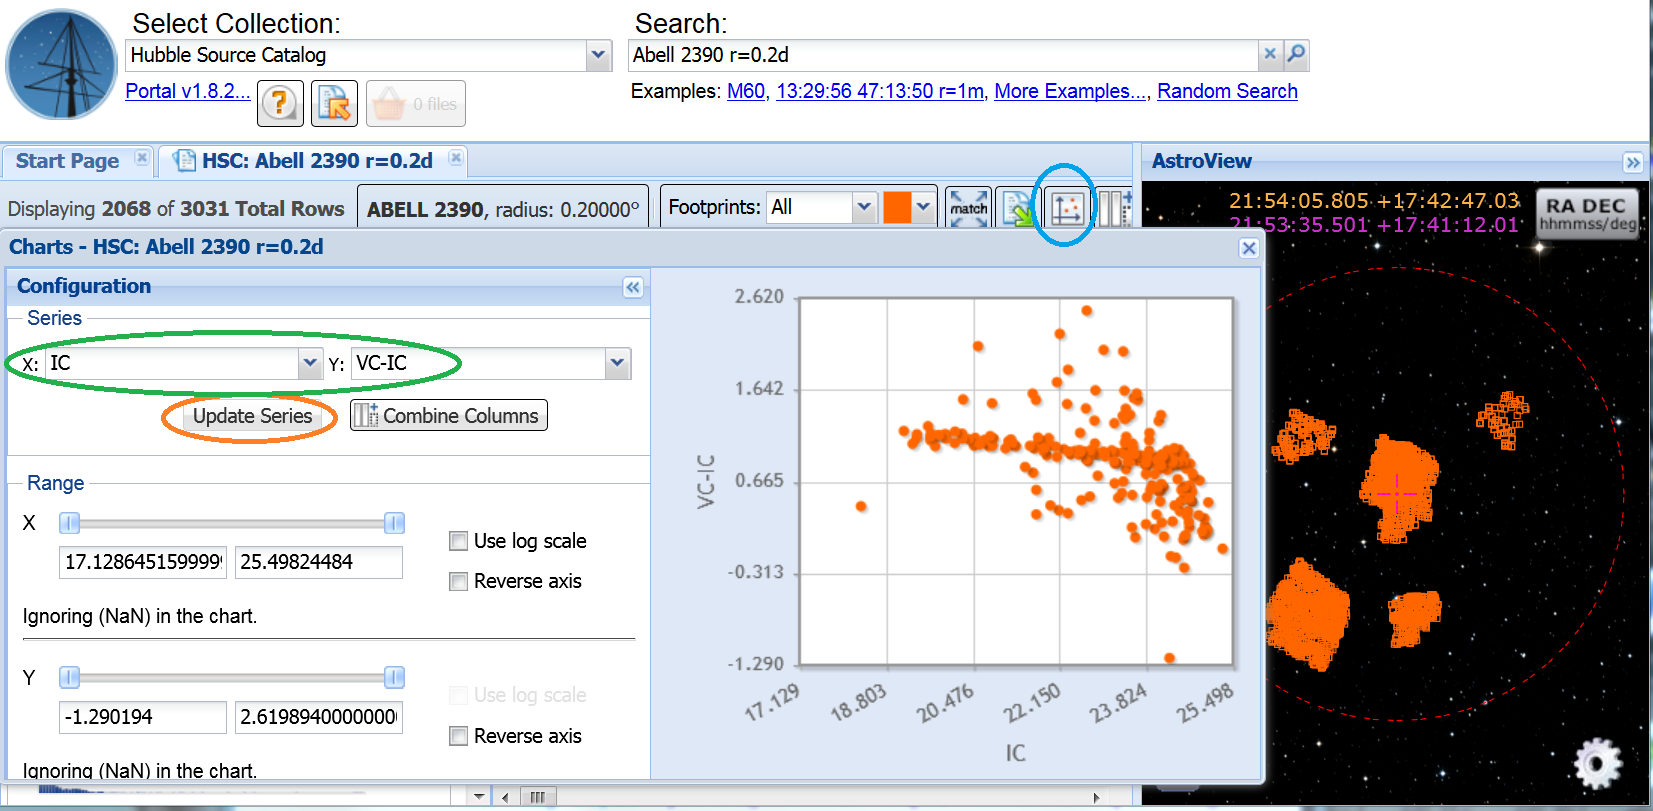
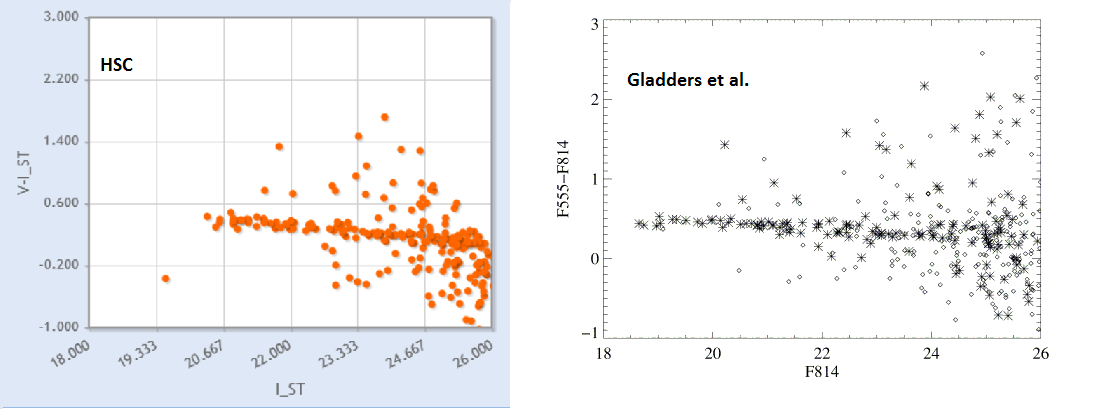
There is clear sequence of sources near the middle of the diagram running with a negative slope. A linear regression fit feature may be added in future Discovery Portal versions, but for now one can estimate the slope of the sequence from the grid, or by moving the cursor within the plot, and find it consistent with m=-0.04. This is the slope of the red sequence expected from clusters in the z=0.2 range, as shown in Gladders & Yee 2000, Figure 2.
A more exact value of the
slope could be obtained by downloading the table using the
 icon,
and employing whatever program you use to perform linear regression
fits (e.g., using Python and 3-sigma clipping, we get a value of
-0.042 +/- 0.007, which is in good agreement with the value of -0.037
+/- 0.0042 from
Gladders et. al. 1998, ApJ, 501, 571).
The HSC figure is shifted slightly relative to the Gladders et al. plot since the HSC uses ABMAG and Gladders uses STMAG magnitudes. The conversion equations are
W2_F555W(STmag) = W2_F555W(AB) - 0.108
W2_F814W(STmag) = W2_F814W(AB) + 0.824.
obtainable using stsdas.synphot, see also the WFPC2 Photometry FAQ.
