For continuum source images, a series of 25 or 26 nearly equally spaced extraction swaths (slit height of 5 pixels) is made in the spatial direction of the high-dispersion SI, with a starting position at small spatial pixel numbers (short-wavelength end). Except for the first and last few Pass 1 swaths, which form short chords along the left and right edges of the camera image, each swath samples fluxes for nearly the entire range of sample positions; that is to say that they include pixels at the spatial ends of the camera which are not affected by contaminated interorder-overlap flux. The ``interorder overlap'' flux is described by a Point Spread Function (PSF) model described below. The accumulated effects of overlapping PSFs increase as the orders become more closely spaced. The accumulation causes the interorder overlap to become increasingly severe until the camera sensitivity falls off at short wavelengths. It is this overlap which causes local background extractions in IUESIPS to be systematically high for short-wavelength orders and which necessitated a strategy for BCKGRD to sample background fluxes from distant uncontaminated regions as well as local contaminated ones.
The fluxes sampled from interorder pixels in Pass 1 are modified if they are affected by contamination from neighboring orders. A model PSF provides an initial estimate of how much the fluxes should be offset before the Chebyshev fit is made. The PSF model itself consists of two components, first, a monotonically decreasing function out to about four pixels and, second, a ``halation ramp'' which extends from four to about seven pixels from the center of each order profile. Each of these components is responsible for order overlap in a particular range of echelle orders. We will refer to the image area where the monotonic portion dominates as the ``Interorder-Overlap Region'' (IOR). The halation component is actually an extension of the IOR. However, BCKGRD treats it separately because, unlike the IOR, its characterization is independent of the order profiles.
The IOR and halation-dominated portions of a Pass 1 swath are indicated
in Figure 10.2 for an SWP image. The initially sampled interorder
fluxes in both the IOR and the halation regions are revised downward
during the course of the calculations. The original and revised
``working'' fluxes are shown in this plot as squares and small crosses,
respectively, and the flux revision for one point is shown as a downward
pointing arrow. The final Chebyshev solution for Pass 1 is shown in our
example in Figure 10.2 as a continuous undulating line.
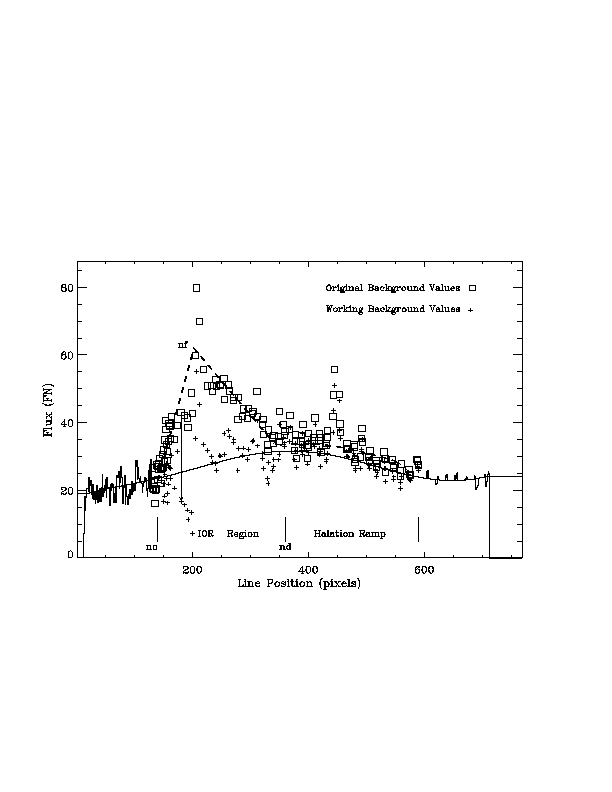 Figure 10.2:
Crosscut of background fluxes from a central
``Pass 1'' swath through an SWP image. Stellar fluxes are off-scale in
this diagram. The triangular area describes the local raw background
fluxes in the Interorder-Overlap Region where order crowding is severe;
the halation region is shown to the right. Small crosses denote the raw
fluxes corrected for overlap by the PSF model. The solid line is the
Pass 1 solution, a Chebyshev, degree-7 polynomial.
Figure 10.2:
Crosscut of background fluxes from a central
``Pass 1'' swath through an SWP image. Stellar fluxes are off-scale in
this diagram. The triangular area describes the local raw background
fluxes in the Interorder-Overlap Region where order crowding is severe;
the halation region is shown to the right. Small crosses denote the raw
fluxes corrected for overlap by the PSF model. The solid line is the
Pass 1 solution, a Chebyshev, degree-7 polynomial.