A study of the spectral resolution in the high-dispersion mode was
performed utilizing several methods. The first measured emission lines
from small-aperture wavelength calibration (WAVECAL) images obtained
using the on-board hollow cathode platinum-neon (Pt-Ne) calibration
lamp. The second measured several features from the emission line
sources V1016 Cyg and RR Tel and interstellar absorption line features
from the calibration standard BD+75![]() 325. The third method
measured absorption features from the calibration standard HD 149757
(Zeta Oph). The WAVECAL images are useful in determining the spectral
resolution as they are not affected by the telescope focus nor are they
subject to astrophysical broadening. The Zeta Oph spectra are
characterized by very narrow interstellar absorption features so they
are also useful for measuring spectral resolution. Therefore, the
measurements taken from WAVECAL and Zeta Oph images represent the best
possible spectral resolution obtainable.
325. The third method
measured absorption features from the calibration standard HD 149757
(Zeta Oph). The WAVECAL images are useful in determining the spectral
resolution as they are not affected by the telescope focus nor are they
subject to astrophysical broadening. The Zeta Oph spectra are
characterized by very narrow interstellar absorption features so they
are also useful for measuring spectral resolution. Therefore, the
measurements taken from WAVECAL and Zeta Oph images represent the best
possible spectral resolution obtainable.
LWP - The WAVECAL and large-aperture Zeta Oph resolution data are displayed in Figures 2.21 and 2.24, respectively. The results, along with the associated one-sigma error bars and linear fits (dashed line), are plotted as a function of order number in both wavelength and pixel space. The dotted line in the pixel space plots is the average of the resolution data over all orders. No small-aperture high-dispersion data of Zeta Oph is available. In addition, the standard star, RR Tel, and V1016 Cyg data were too noisy to yield suitable results. The large-aperture Zeta Oph measurements are quite similar to the small-aperture WAVECAL analysis. The spectral resolution in wavelength space is approximately 0.18Å FWHM at order 75 and linearly decreases (roughly) to 0.11Å at order 117. The pixel space data for both WAVECALs and Zeta Oph show the same improvement in resolution between orders 95 and 110.
The IUE Systems Design Report (GSFC 1976) lists 15,000
(![]() ) as the high-dispersion resolution for the
long-wavelength cameras. This yields 0.22Å for order 69, 0.17Å for
order 90, and 0.13Å for order 123. These numbers are comparable to
the NEWSIPS results of 0.24Å, 0.15Å, and 0.12Å for these same
orders. An analysis of IUESIPS spectral resolution was performed by
Evans and Imhoff (1985) using FWHM measurements obtained from WAVECAL
images. The results are as follows: 0.22Å for order 75, 0.17Å for
order 83, 0.13Å for order 96, and 0.13Å for order 116. These
figures are very similar to the NEWSIPS results of 0.20Å, 0.14Å,
0.15Å, and 0.13Å.
) as the high-dispersion resolution for the
long-wavelength cameras. This yields 0.22Å for order 69, 0.17Å for
order 90, and 0.13Å for order 123. These numbers are comparable to
the NEWSIPS results of 0.24Å, 0.15Å, and 0.12Å for these same
orders. An analysis of IUESIPS spectral resolution was performed by
Evans and Imhoff (1985) using FWHM measurements obtained from WAVECAL
images. The results are as follows: 0.22Å for order 75, 0.17Å for
order 83, 0.13Å for order 96, and 0.13Å for order 116. These
figures are very similar to the NEWSIPS results of 0.20Å, 0.14Å,
0.15Å, and 0.13Å.
LWR - The WAVECAL spectral resolution measurements are shown in Figure 2.22 along with the corresponding linear fit (dashed line) and average (dotted line). The FWHM trends (wavelength space) below order 80 are quite similar to the LWP figures (i.e., a linear dependence of FWHM on order number). The camera resolution in wavelength space is nearly constant for orders 80 through 115, with a slight degradation in LWR resolution above order 115. This trend is easily visible in the the pixel space resolution plot and is evident from the deviation of the FWHM measurements from the mean (dotted line).
Cassatella et al. (1981) and Cassatella and Martin (1982) report a nearly constant FWHM (wavelength space) as a function of order number for WAVECAL images processed through IUESIPS. The average FWHM from their analysis is approximately 0.18Å above order 81; a value which is higher than the corresponding NEWSIPS FWHM of 0.14Å. They report a FWHM of 0.22Å for order 72, which again is much higher than the NEWSIPS results of 0.19Å. Evans and Imhoff (1985) also measured spectral resolution using IUESIPS processed WAVECAL images. They present FWHM values of 0.19Å, 0.17Å, 0.16Å, and 0.15Å for orders 75, 83, 96, and 116, respectively. The corresponding NEWSIPS values for these same orders are: 0.19Å, 0.14Å, 0.15Å, and 0.14Å. Boggess et al. (1978) quote a constant FWHM of 0.19Å for WAVECAL images, regardless of order number. This contradicts all subsequent reports written on this subject as well as the NEWSIPS results shown here. Their analysis was performed early in the life of IUE; perhaps the camera characteristics had not yet stabilized at this period in time.
SWP - The WAVECAL, Zeta Oph, and large- and small-aperture
stellar source spectral resolution data are displayed in
Figures 2.23, 2.25, 2.26, and 2.27. As is the
case with the LWP and LWR, the plots include one-sigma error bars and linear
(dashed line) and mean (dotted line) fits to the data. In
Figures 2.26 and 2.27, the emission line measurements for
orders 111 and above were excluded from the analysis when performing the
linear fit to the stellar data because they were highly discrepant. The
spectral resolution in wavelength space for the WAVECAL, Zeta Oph, and
stellar source images shows no dependence on wavelength within an order
and a roughly linear dependence on order number. Unlike the LWP, the SWP
resolution from the Zeta Oph analysis (Figure 2.25) is much worse
than the corresponding WAVECAL data (Figure 2.23). The stellar
source results are somewhat inconclusive for orders 111 and above. The
emission line widths are dramatically higher than the corresponding
absorption line measurements. This trend was also seen in the analysis
by Grady (1985). The IUE Systems Design Report (GSFC 1976) quotes a
figure of 10,000 (![]() ) for the spectral resolution
in high-dispersion mode. This corresponds to a FWHM of approximately
0.2Å for order 66 and 0.1Å for order 125. This same trend is seen
in the top plot (Figure 2.23) of the WAVECAL resolution analysis;
the spectral resolution is essentially a constant value in pixel space
(bottom plot). The stellar source resolution measurements in pixel space
(bottom plot of Figures 2.26 and 2.27) show some degradation
towards higher order numbers. In addition, the small-aperture data
(Figure 2.27) indicates an 8% improvement in resolution over the
large-aperture counterpart (Figure 2.26).
) for the spectral resolution
in high-dispersion mode. This corresponds to a FWHM of approximately
0.2Å for order 66 and 0.1Å for order 125. This same trend is seen
in the top plot (Figure 2.23) of the WAVECAL resolution analysis;
the spectral resolution is essentially a constant value in pixel space
(bottom plot). The stellar source resolution measurements in pixel space
(bottom plot of Figures 2.26 and 2.27) show some degradation
towards higher order numbers. In addition, the small-aperture data
(Figure 2.27) indicates an 8% improvement in resolution over the
large-aperture counterpart (Figure 2.26).
The general trend of the wavelength-space resolution for the WAVECAL images is approximately the same for every IUESIPS study that has been reviewed (i.e., Boggess et al. 1978, Cassatella et al. 1981, Cassatella and Martin 1982, and Evans and Imhoff 1985). That is, the camera resolution in wavelength space varies roughly linearly with order number and improves towards shorter wavelengths (0.19Å for order 69 and 0.09Å for order 106). The results from analysis of WAVECAL images processed through NEWSIPS are almost identical to these figures. Penston (1979) reported SWP large-aperture FWHM values of 0.20Å for absorption lines and 0.24Å for emission lines. These figures are comparable with the average NEWSIPS results of 0.21Å and 0.23Å respectively. However, Penston's (1979) measurements for the small-aperture resolution are no better than the large aperture. This result could be supported by the NEWSIPS analysis as the apparent improvement in small-aperture resolution is less than the one-sigma error of the FWHM average for any given order. Grady (1985) assessed the effects of the two-gyro control mode on high-dispersion data using large-aperture RR Tel spectra. The mean resolution (averaged over all orders) from the Grady analysis (0.22Å) agrees with the average NEWSIPS resolution result.
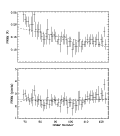 Figure 2.21: LWP high-dispersion spectral resolution from
WAVECAL analysis.
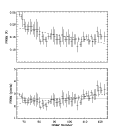 Figure 2.22: LWR high-dispersion spectral resolution from
WAVECAL analysis.
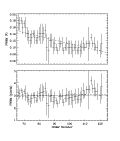 Figure 2.23: SWP high-dispersion spectral resolution from
WAVECAL analysis.
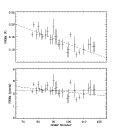 Figure 2.24: LWP high-dispersion spectral resolution from
analysis of large-aperture Zeta Oph data.
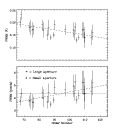 Figure 2.25: SWP high-dispersion spectral resolution from
analysis of large- and small-aperture Zeta Oph data. Small-aperture data
is horizontally offset to the left of the large-aperture data by half an
order.
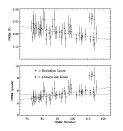 Figure 2.26: SWP high-dispersion spectral resolution from
large-aperture stellar source analysis. Absorption line data is
horizontally offset to the left of the emission line data by half an
order.
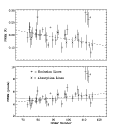 Figure 2.27: SWP high-dispersion spectral resolution from
small-aperture stellar source analysis. Absorption line data is
horizontally offset to the left of the emission line data by half an
order.