|
|||||||||||||||||||
|
|
|||||||||||||||||||
The Multimission Archive at STScI Newsletter
| February 2012 | Space Telescope Science Institute |
| The Multimission Archive at STScI (MAST) Newsletter disseminates information to users of the HST, GALEX, Kepler, FUSE, IUE, Copernicus, EUVE, HUT, EpocH, UIT, WUPPE, HPOL, IMAPS, BEFS, TUES, VLA-FIRST, and XMM-OM data archives supported by MAST. Inquiries should be sent to archive@stsci.edu. |
Table of Contents
Hubble Legacy Archive -- Data Release 6
|
Data Release 6 (DR6) of the Hubble Legacy Archive (HLA) is now available (hla.stsci.edu).
The HLA provides easy access to enhanced science-ready HST data products from Hubble using advanced search and browsing
capabilities. New for DR6 are enhanced WFC3 images produced with a revamped pipeline and an
improved data format, including pixel-by-pixel exposure time information and more details on the
contributing exposures. The HLA team processed and released about one year's worth of newly public ACS data.
The SAAClean procedure was applied to a fraction of previously released NICMOS Data. Several new sets of
community contributed high-level science products, including data produced by the Multi-Cycle Treasury
programs, are now available from the HLA.
High-level science products can be quickly located by entering the name of the program (e.g., CANDELS,
CLASH, PHAT, GOODS, etc.) in the 'Proposal ID' advanced search option.
The HLA interface now features improved compliance with Virtual Observatory (VO) standards and provides more feedback to users conducting searches using lists of positions. Users may now export images directly to JPEG files, utilize improved image contrast controls, select large numbers of datasets with a single "Select All" button. The HLA interface is at http://hla.stsci.edu, and detailed release notes can be found at hla.stsci.edu/hla_release.html.
|
||
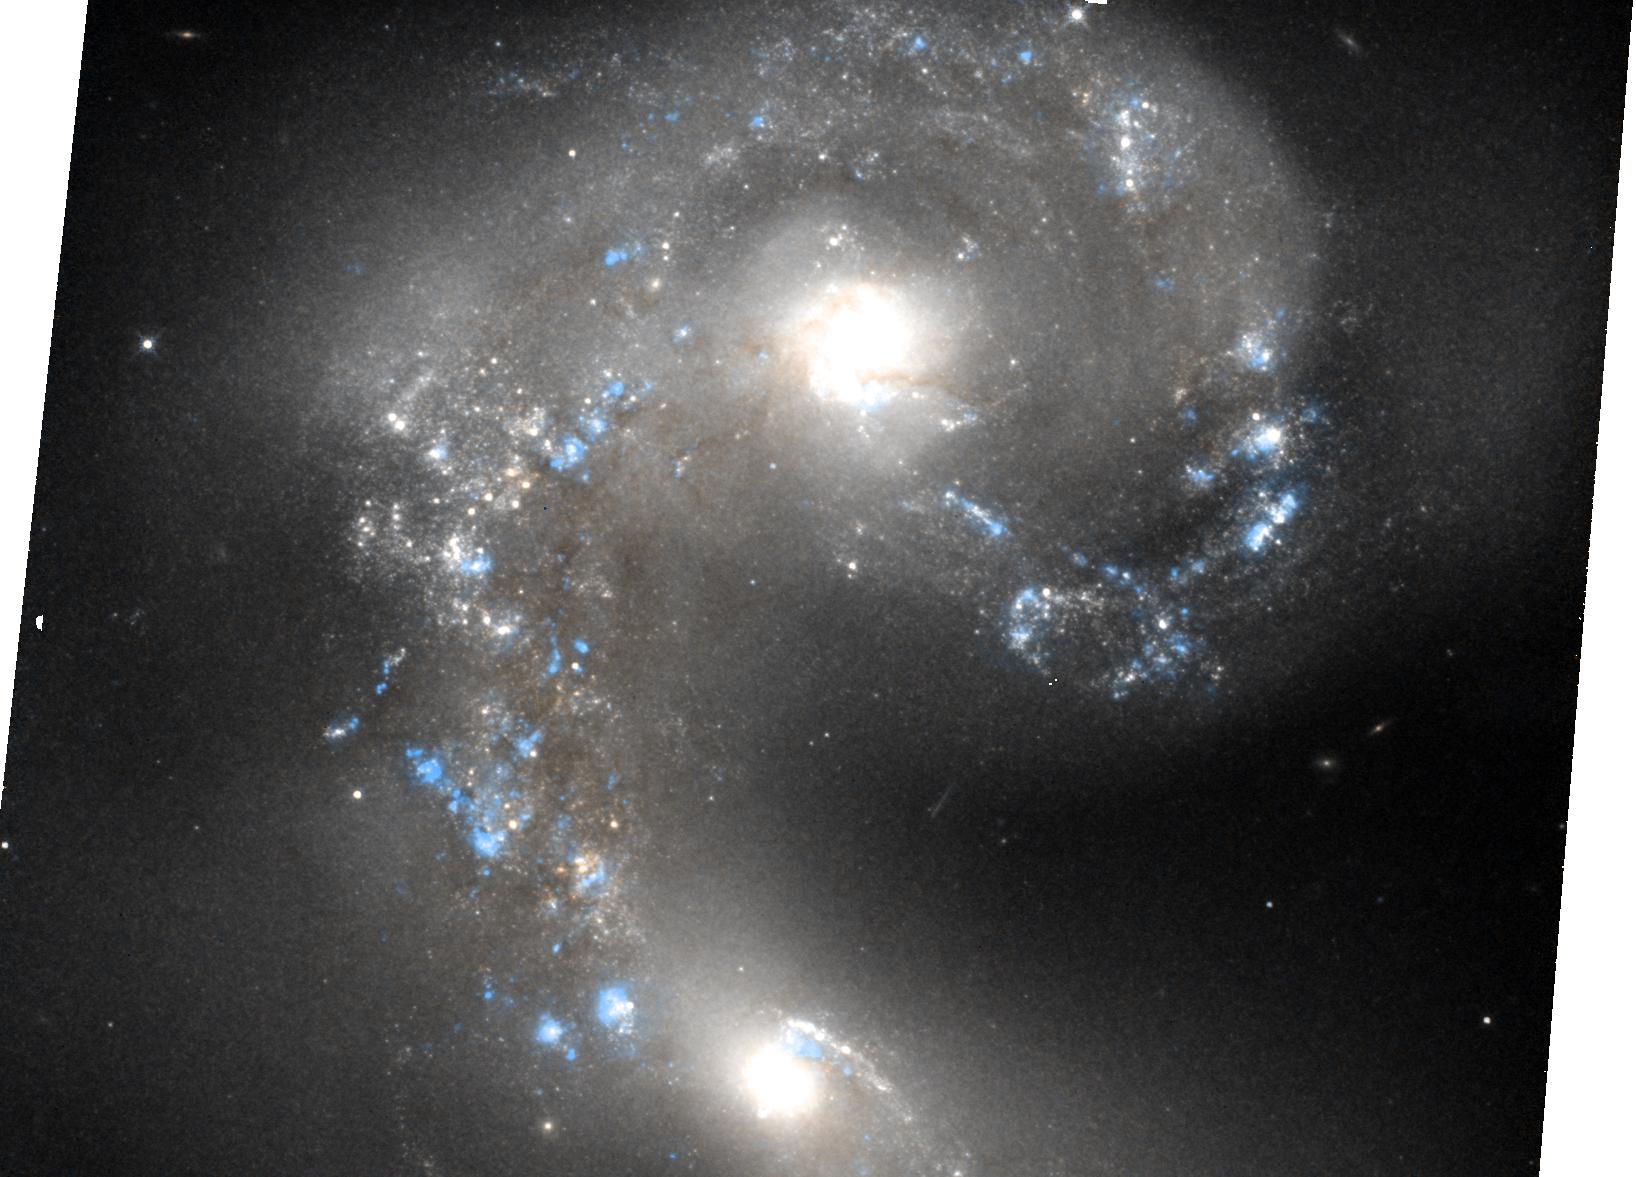 Antennae (WFC3 IR) |
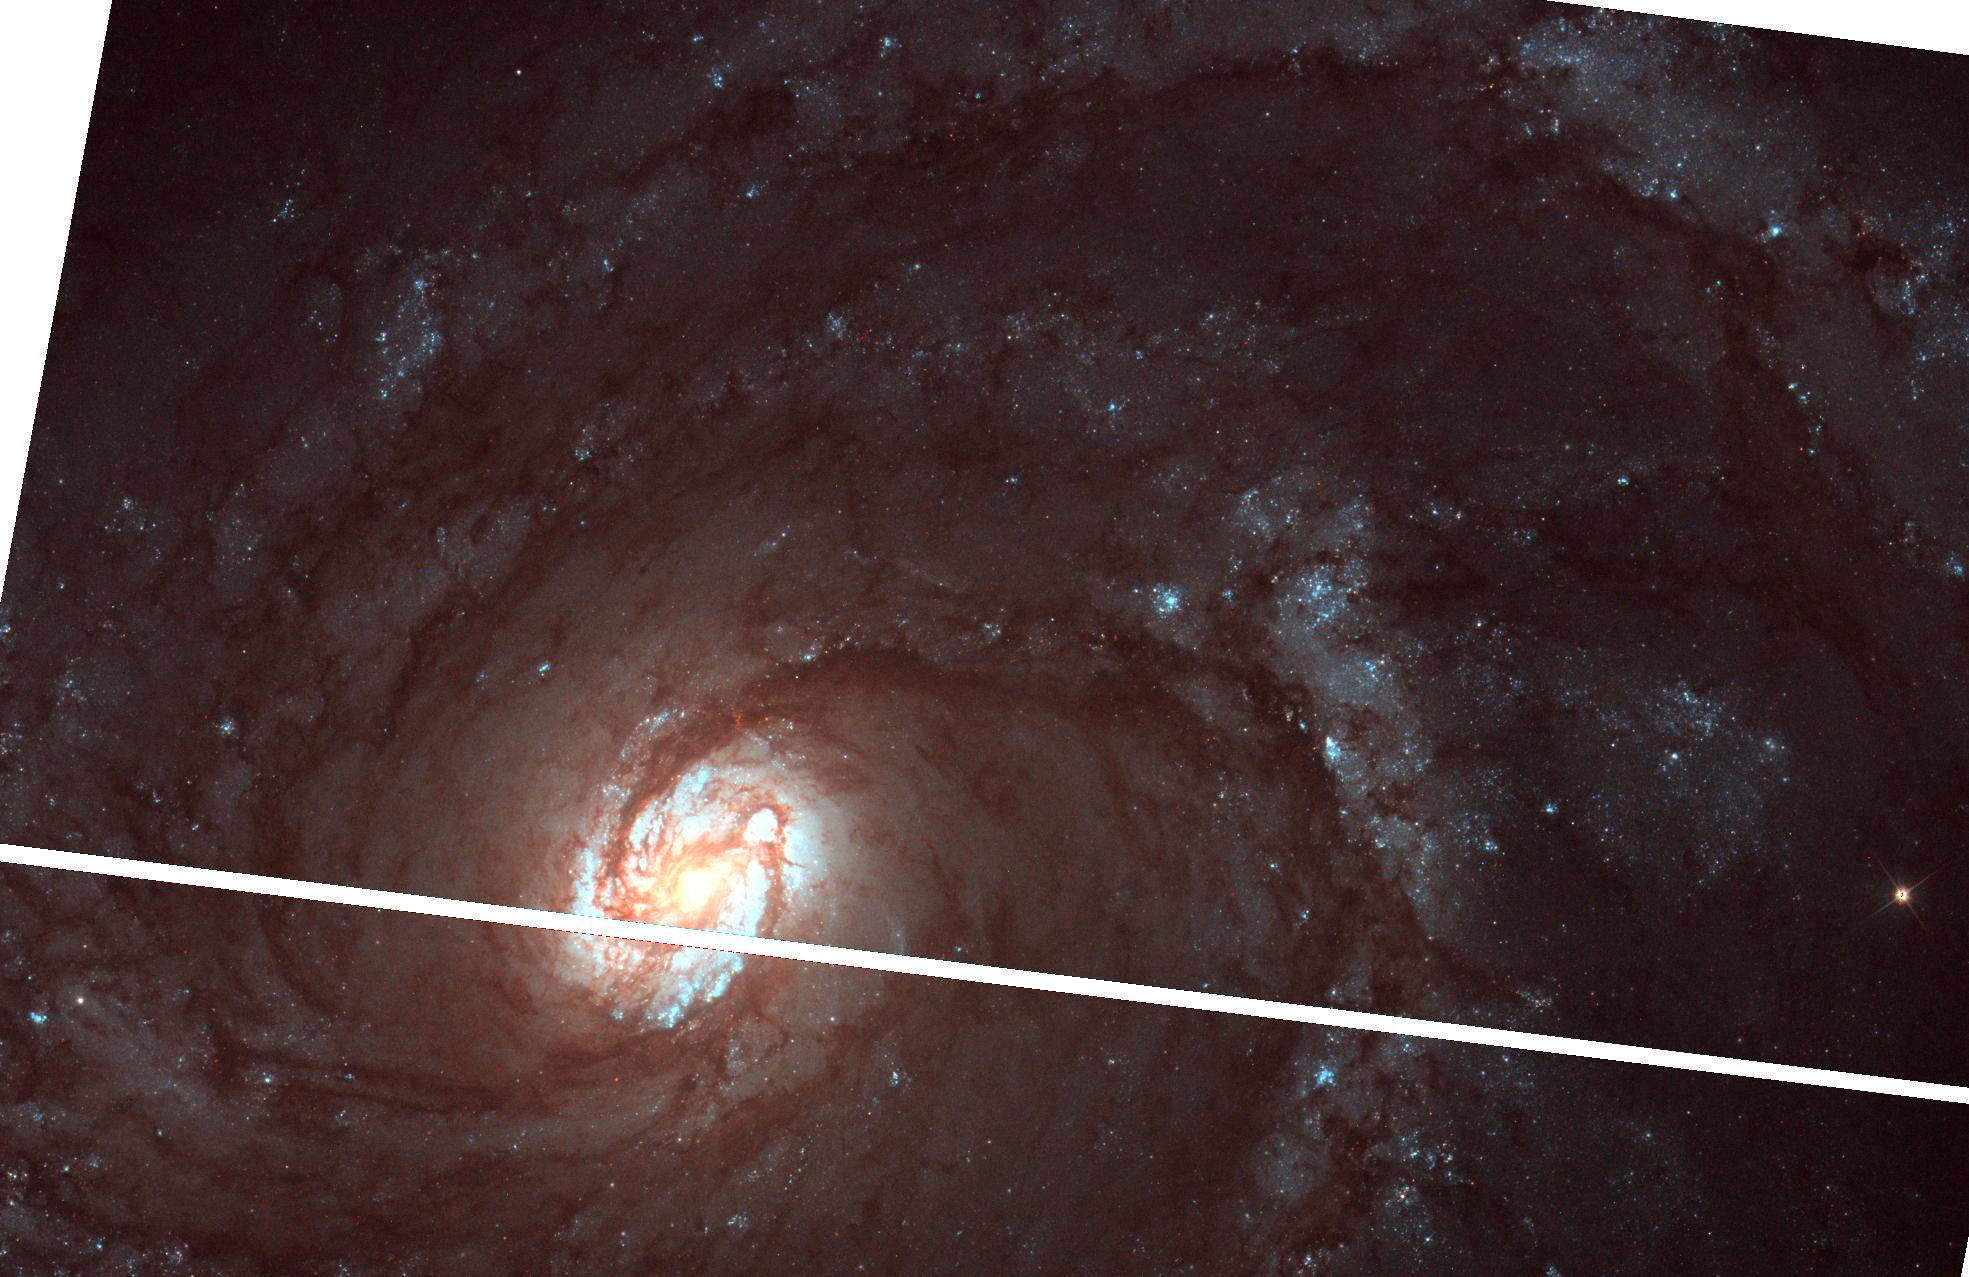 NGC 4321 (WFC3 UVIS) |
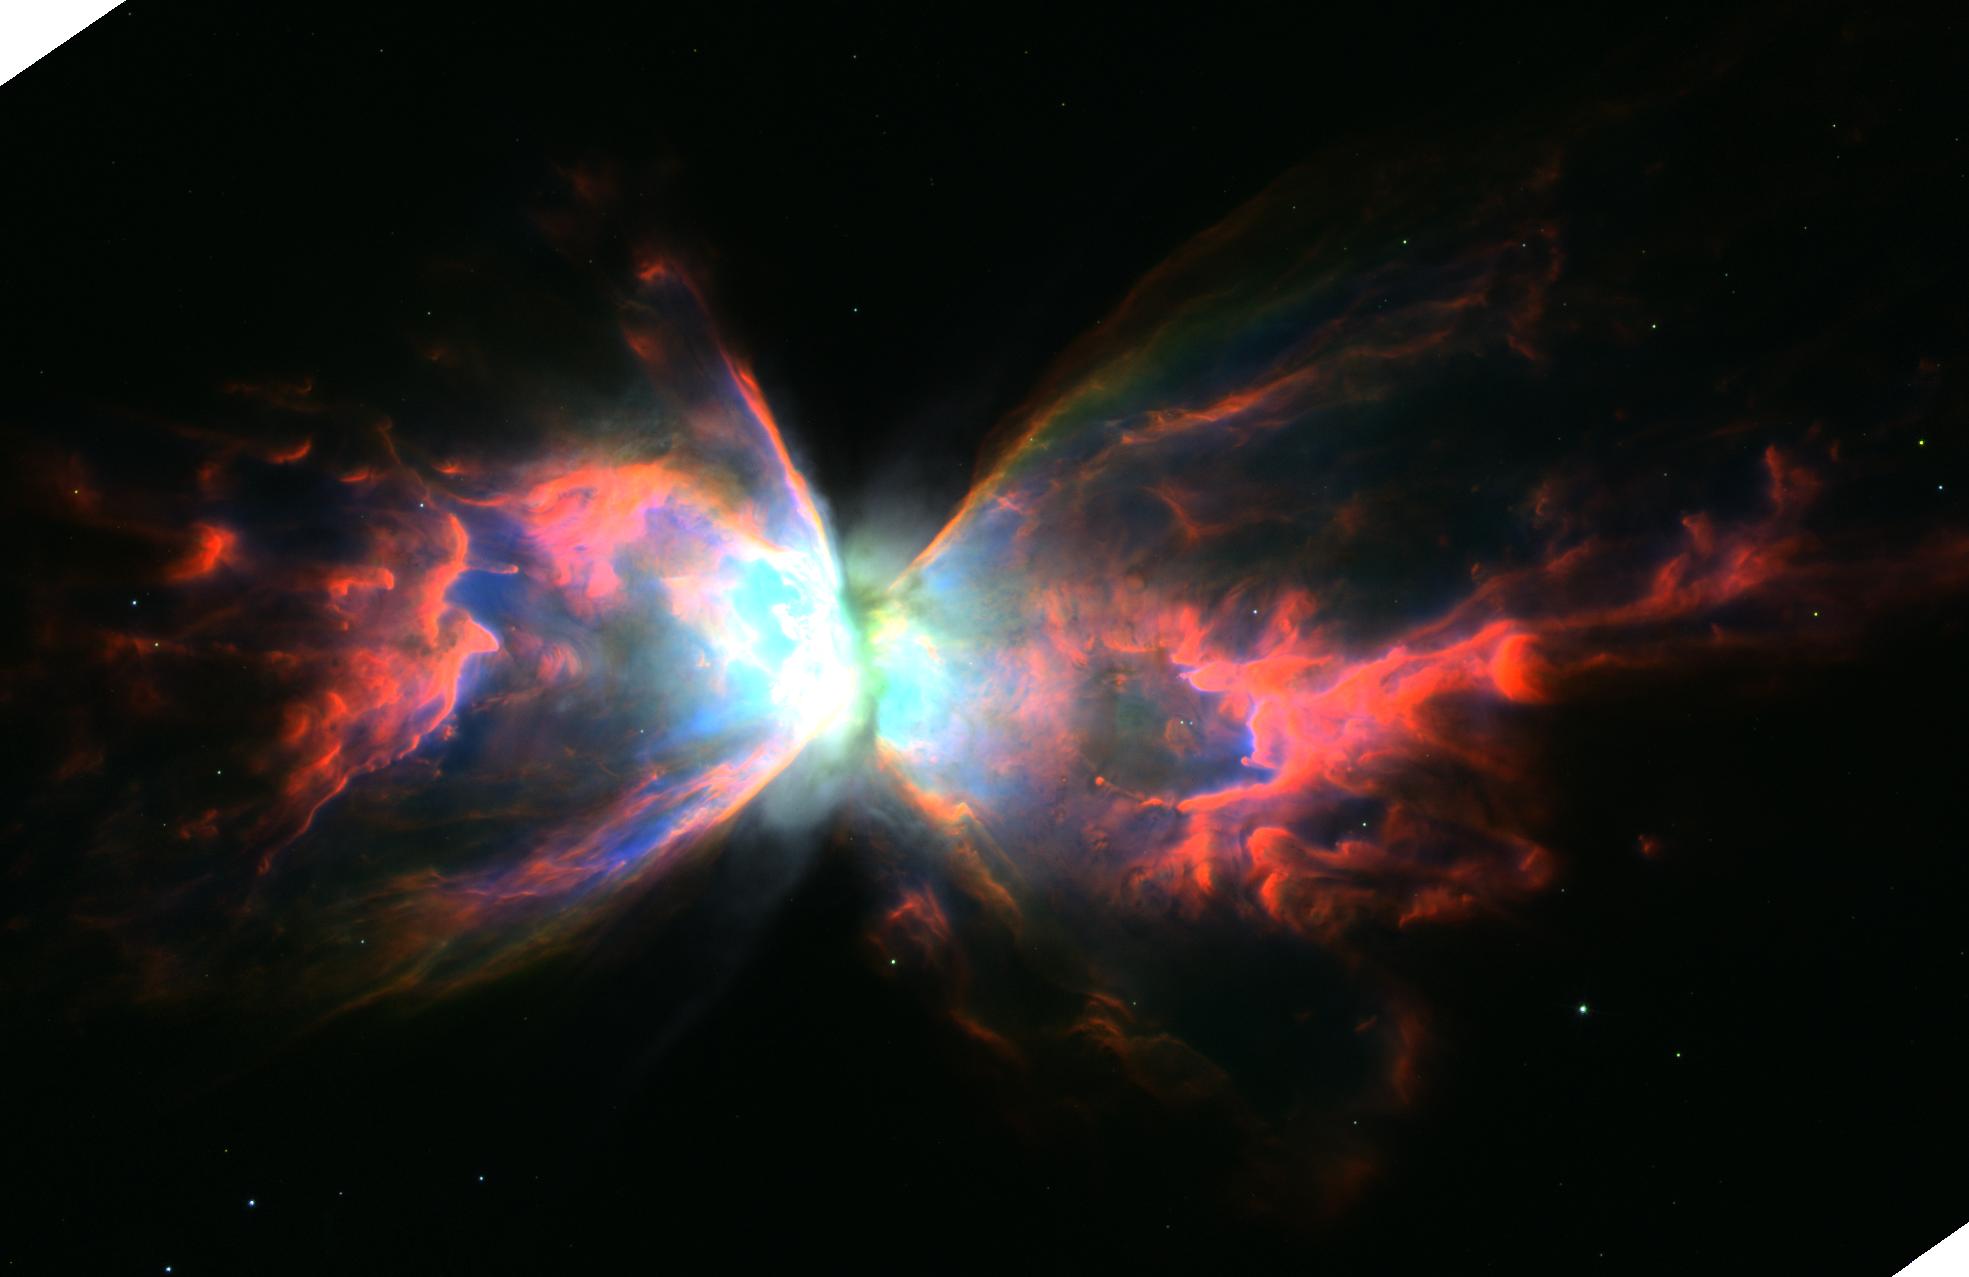 NGC 6302 (WFC3 UVIS) |
.jpg) NGC 2841 (WFC3 UVIS) |
.jpg) NGC 5128 (WFC3 UVIS) |
 SDSSJ123936.05+122620.0 |
Return to the Table of Contents
HST Archive Infrastructure Upgrade
The archive and data processing server infrastructure underwent a long overdue upgrade recently. Since 2003, the HST Data Archive and Distribution System (HST-DADS), and Operational Pipeline Unified System (OPUS) servers have been running on a SunFire cluster with Solaris and utilizing Sybase database servers. This configuration was also used for Kepler. This upgrade consisted of deploying new DELL PowerEdge servers running Red Hat Enterprise Linux and utilizing MicroSoft SQL Database Servers. The migration of HST-DADS and OPUS to this new configuration was a complicated task because it involved migrating the 20+ years of HST data and verifying that the new software produced products identical to the old configuration, taking into account the new software/hardware architecture. This involved months of testing with the instruments teams. Another large effort involved the verification and validation of the database servers. This involved verifying data content and query performance between the two systems. Finally, we ran the two systems in parallel ops for approximately 6 months, verifying functionality between the two systems and minimizing impact to our customers. In Sep 2011, the old HST system was shut off and decommissioned, with the Kepler system following shortly after, finishing up in Oct 2011.
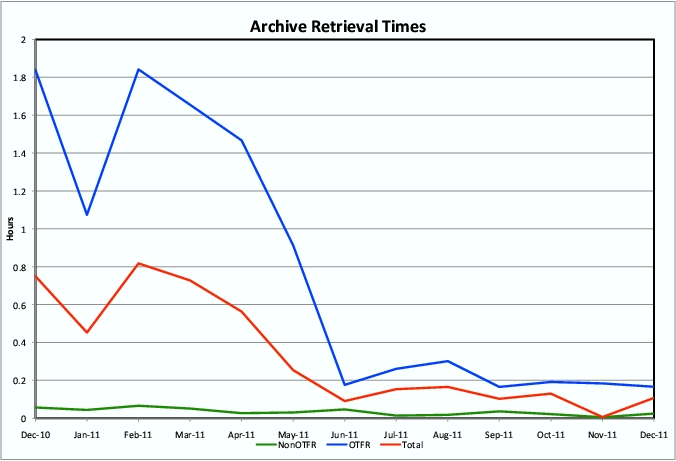 To date the new systems are performing very well, distribution times have fallen to about 8 minutes on average for HST data. The new configuration provides us with a stable environment and room to grow in terms of storage and processing capacity.
The figure to the right plots the Median Retrieval Times for each processing type since January 2011. The Y-Axis is the median time (ranging from 0-2 hours). The blue line represents the median retrieval time for data processed "On the Fly" or OTFR. The green line non-OTFR data. The red line is for all data.
The dramatic drop in OTFR processing times in June 2011 corresponds with the migration of the production processing activities to the new infrastructure.
Note that retrieval times include transfer time to the user in addition to the time required to process the data, so large requests transfered to a relatively slow node may skew the statistics somewhat.
Click on the image to see a larger version of the plot.
Return to the Table of Contents
HST CTE Correction Coming Soon
A new algorithm that performs a Pixel-based charge transfer effect (CTE) correction is expected in the production pipeline in late Spring. Initially the algorithm will be available only for ACS data. When CTE is activated, the pipeline will produce two sets of data products for each set of ACS observations. In addition to the standard data products (_CRJ, _FLT and _DRZ files), there will be three new files (_CRC, _FLC and _DRC), which will contain the CTE-corrected data products. Both sets of products will be delivered to the users by the archive. For more details, see the ACS team page, http://www.stsci.edu/hst/acs/performance/calacs_cte/calacs_cte.html.
 |
 |
 |
|
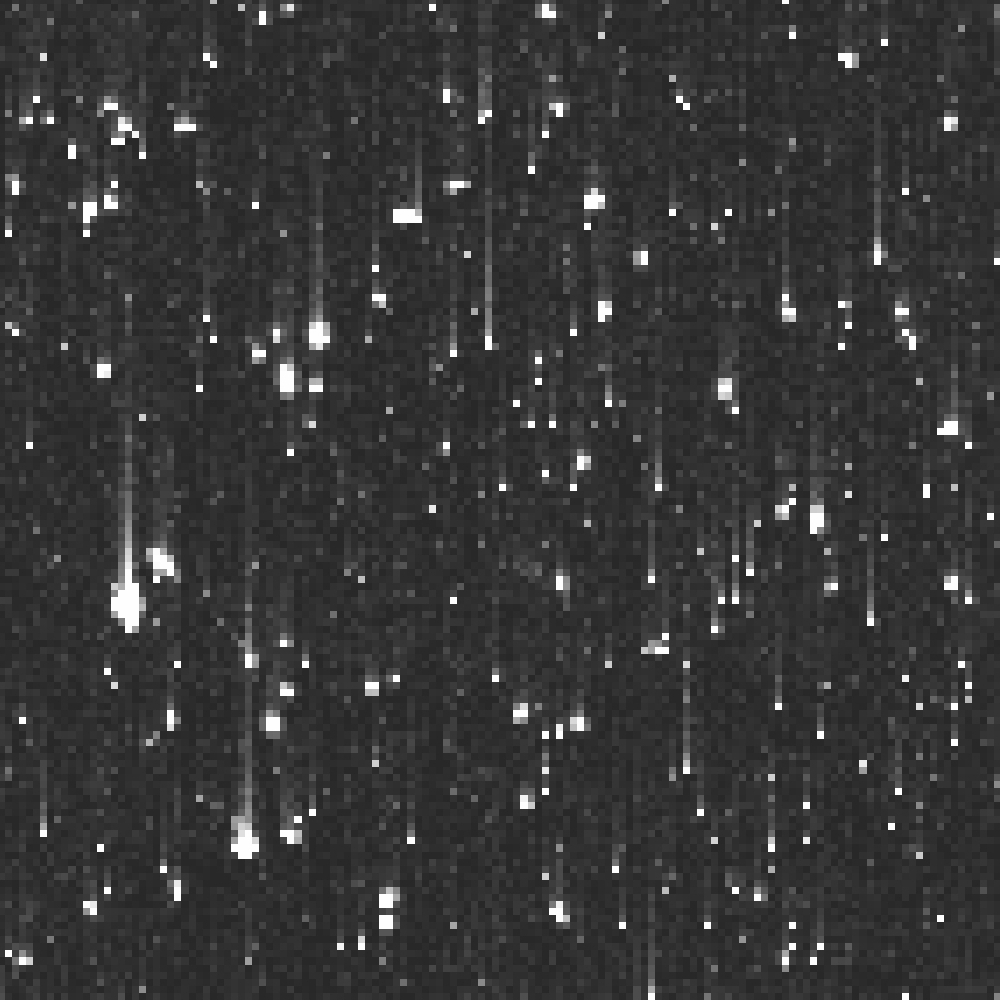
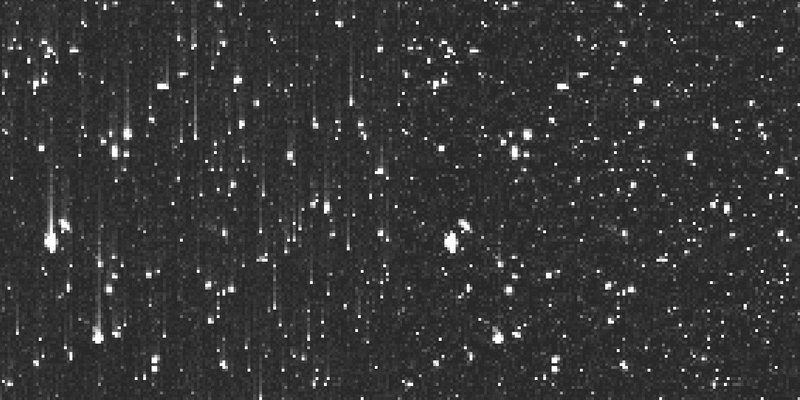
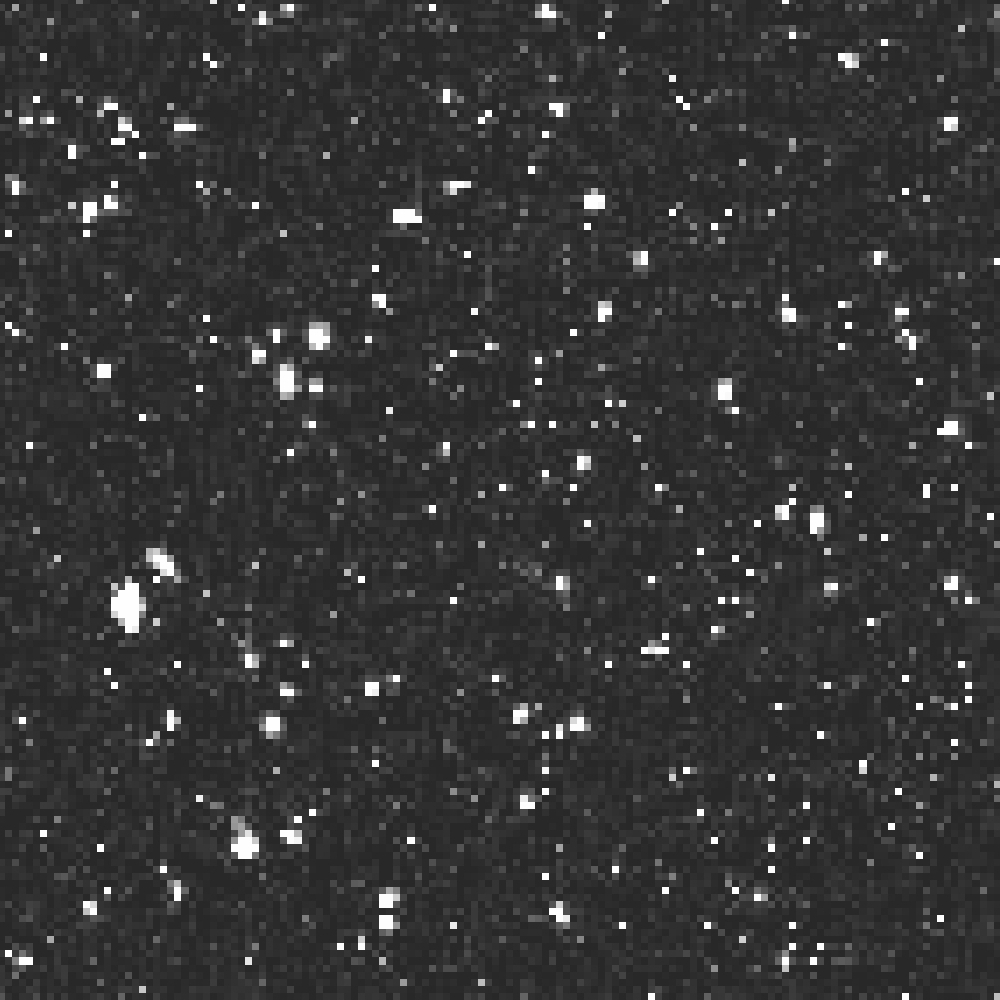
Figure 5 from the team page: (Left) A 1000 x 1000 pixel region of the top of the extension 1 chip in image jbmncoakq_flt.fits. The CTE vertical trails are clearly visible. (Right) The reconstructed _FLC image after the execution of CALACS. (Center) An animation of the two adjacent images, blinking at a one second interval. | ||
Return to the Table of Contents
Persistence and After-Images in WFC3/IR Data
Article is excerpted from an article by Knox Long and Sylvia Baggett for the upcoming STScI Newsletter.Most infrared arrays show after-images, known as persistence, following exposures that significantly saturate the detector. The mercury-cadmium-telluride detectors on the Wide Field Camera 3 (WFC3) infra-red channel (IR) are no exception. The after -images can last for several hours. As a result, the after-images can masquerade as stars or nebulae in exposures that follow IR observations of bright objects. Although after-glows that can affect the science quality of images are rare, observers need to account for them when analyzing WFC3/IR images.
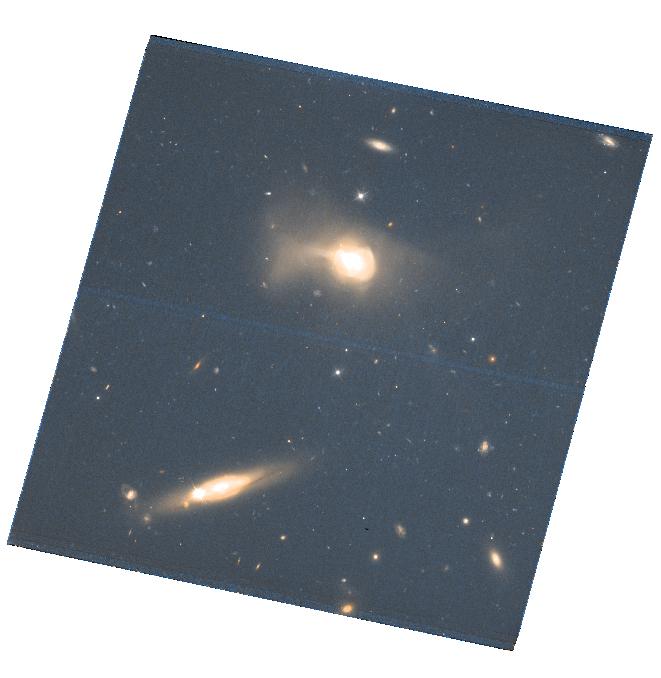
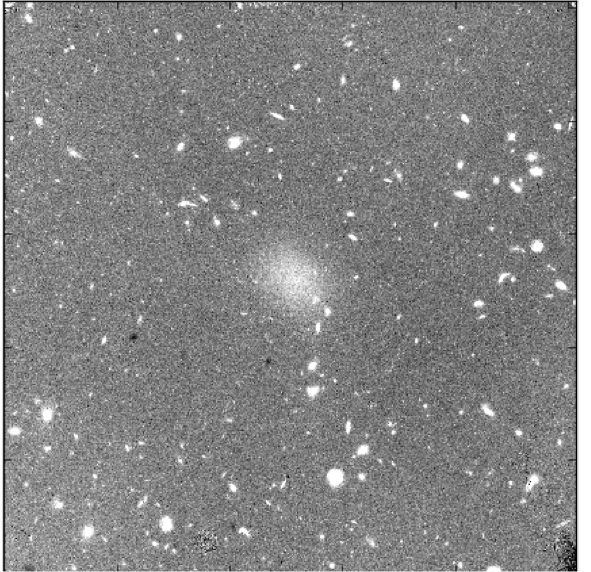 The after-image contained in the image to the right is exceptional. Had it not been recognized as an after-image and publis
hed, it would have certainly been embarrassing. Had the observation been an important part of the observer's program, a repeat observation of the field would have been needed. However, persistence at this level is rare. In 98% of the WFC3/IR image
s taken over the six-month period from January through June 2010, less than 2% of the pixels were affected by persistence above 0.03 electrons s-1 per pixel. For 95% of WFC3/IR images, less than 0.5% of pixels were affected as this level.
To the right is an example of persistence. This image from the WFC3/IR was obtained in parallel with a spectrum from the Cos mic Origins Spectrograph of the active galactic nucleus Ton 580. The diffuse region in the center of the image is unlike any thing found near Ton 580. It is the after-image, due to the persistence of an image of the nearby spiral galaxy NGC 2841, wh ich the WFC3/IR had observed two hours earlier.
One way to eliminate the problem of persistence would be to space out WFC3/IR observations sufficiently to ensure that after-images had time to decay away before the next observation. Indeed, instrument scientists do attempt to identify potential "bad actors" — sources that could result in after-images—using information provided by observers or implicit in Phase II proposals. Typically observations with bad actors are observations of crowded star fields, such as globular clusters the Galactic plane, or the central regions of nearby galaxies. Further WFC3 observations are inhibited for two orbits after an observation on the bad-actor list is scheduled.
As a result of this screening, in recent cycles we have encountered far fewer after-images like the one shown the example. Nevertheless, WFC3/IR observations constitute a substantial portion of Hubble's entire observing program, and while we can eliminate many potential after-images before the fact, we cannot avoid many smaller—but still significant—problems with persistence. Therefore, we have developed a model to address after-images occurring in WFC3/IR data. The model predicts the after-images in a new exposure due to previous exposures, taking into account the time that has elapsed.
We have incorporated the persistence model into prototype software and have used the model to produce after-images for all existing WFC3/IR data. A more detailed description of persistence as it applies to the WFC3/IR channel, including advice on how to minimize its effects when planning observations, is available at http://www.stsci.edu/hst/wfc3/ins_performance/persistence/.
Although after-images are not part of the standard calibration products for WFC3/IR observations, they—and various related files—are available through the Multimission Archive at Space Telescope (MAST), at http://archive.stsci.edu/prepds/persist.
Observers can use persistence files in several ways. First, and most importantly, they can use the files to identify regions of the detector that are affected by persistence, so these can be excluded from the analysis. (Ancillary information on the MAST page allows users to see whether there is anything to worry about in the way of persistence.) Secondly, with caution, they can use the information to actually correct the data for persistence. The figure below shows an example of persistence correction.

Return to the Table of Contents
New Content for the Kepler Archive
Since the last Newsletter, there have been several changes and additions to the Kepler Archive.
Light curves have a new format. An APERTURE extension, showing the pixels observed and the pixels used in the photometry, was added. Some existing columns were renamed, including those for the fluxes. The names now reflect the content of the columns. Quality information and centroiding information are given in additional columns. The Archive Manual contains a description of the new format light curves.
Co-trending Basis Vectors, CBV, http://archive.stsci.edu/kepler/cbv.html are now available. These data products can be used to remove instrumental systematics from the Kepler light curves. There is one FITS file per quarter. See the Kepler Archive Manual for a description of the CBV file format, and see Data Release Notes 12 for more information on the CBV characteristics and how to use them. For a tool to fit and apply CBVs to your Kepler light curve, see http://keplergo.arc.nasa.gov/ContributedSoftwareKepcotrend.shtml. Users should download the November 30, 2011 version of these files.
The pixel response function, PRF, is now available at MAST on the Focal Plan Characterization Model page, http://archive.stsci.edu/kepler/fpc.html. This is the first of the Focal Plane Characterization Model files. The PRF model is comprised of five images per channel. These images describe the PRF in the four corners and the center of the channel. Each PRF was determined by using 10 stars near the corners (or at the center) of the CCD. For computational simplicity, each PRF may be assumed to be located exactly at the active CCD corner (or center). This approximation has negligible impact on the interpolated PRF across the chip. See the Kepler Archive Manual for more information.
FFIs delivered after November 2011 have improved WCS. More recent FFIs also have an uncertainty file. When present, uncertainty files are now included in the ftp directory. MAST expects earlier FFIs will be reprocessed and delivered at some future date.
The Kepler Spacecraft ephemeris, also known as a spice kernel, is being made available to users via anonymous ftp or via the browser at http://archive.stsci.edu/pub/kepler/spice . Since the ephemeris is accumulative, only the most recent file is available. See the kepler Ancillary Files page, http://archive.stsci.edu/kepler/ancillary.html, for more information and links.
Return to the Table of Contents
Accelerated Kepler Data Release
The Kepler Project has accelerated the release of the Key Project (Planetary Search and Cluster observations) data from Kepler to the public. Please note that Guest Observer (GO) and Kepler Asteroseismological Science Consortium (KASC) data will continue to have a one year exclusive use period for data taken through Q13. The table below gives the new release dates for most Key Project data. Data for Key Project targets shared with a GO or KASC proposal will have a one year exclusive use period, which starts upon ingest of the data into the archive at MAST.
| Quarter | New Release Date |
|---|---|
| 4, 5 and 6 | January 7, 2012 |
| 7, 8 and 9 | July 28, 2012 |
| 10, 11, 12 and 13 | October 28, 2012 |
| 14 and ff | Public on ingest (receipt at MAST) |
Return to the Table of Contents
New filter magnitudes for Kepler field objects
Various ground-based observing groups have surveyed the Kepler sky region and have made catalogs available to MAST that provide new filter magnitudes for objects in the Kepler field of view. A great many objects are not listed in the Kepler Input Catalog.
The new magnitudes can be accessed by requests to the Kepler Enhanced Target Search page, http://archive.stsci.edu/kepler/kepler_fov_enh/search.php Users should note that the addition of deep blue to far UV (GALEX) magnituders enable the selection of blue objects with greater reliability. The addition of the UK IRT J-band survey by Phil Lucas permits the selection of redder and fainter (chiefly extragalactic) objects.
Generally the Enhanced Target Search form behaves just like the current Target Search page, but it adds new filter magnitudes and colors. However, by clicking the "KIC targets only" button off users can extend their searches to a total of 10 million objects on the Kepler field rather than the KIC's 4.4 million. Within a few months MAST expects that the Enhanced form will supercede the current Target Search one. Note also that for more advanced queries a version of our "KeplerColors" catalog is available on MAST's Casjobs pages (http://mastweb.stsci.edu/kplrcasjobs/).
At this writing MAST is ingesting a UBV catalog of the Kepler field by M. Everett, S. Howell, and K. Kinemuchi. MAST will be receiving another catalog from the European "INT/KIS" Survey group this spring that lists magnitudes in u, g, r, i, and Halpha. The availability of magnitudes from these two surveys will be announced on the MAST news corner.
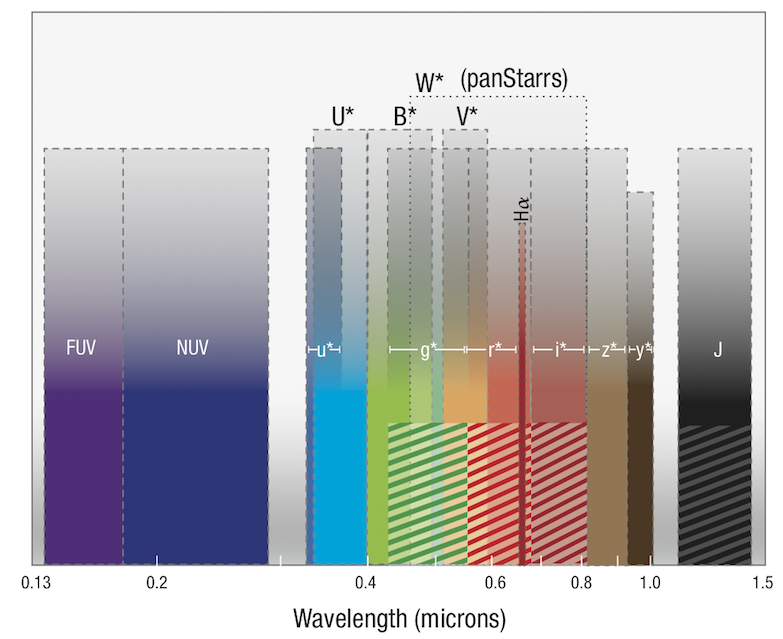
Wavelength coverage in microns for ground based survey filters of the Kepler field. Color coding differentiates filter bandpasses. Short thatched rectangles denote Sloan filters the magnitudes which are already available in the Kepler Input Catalog. Also shown are the GALEX NUV and FUV, 2MASS catalog J, and UKIRT J mag survey. The 2MASS HK, which extend out to 2.1 microns are not shown. Data for asterisked filters (most tall rectangles) will be added during the next few months. the panStarrs bandpass is about the same as the (unfiltered) bandpass of the Kepler camera.
Return to the Table of Contents
Kepler Condition Flag
 MAST has added a condition flag to the Kepler Target Search and Kepler Data and Retrieval Search interfaces. The new field, with a pull down menu, currently allows users to search for targets with one of seven conditions: Eclipsing Binary, Exoplanet Host Star, False Positive, Null Kepmag, Possible Artifact, Red Giant or Released Candidate. See http://archive.stsci.edu/kepler/condition_flag.html for more details.
The conditions are target-based, not observation-based, and may not apply equally to all entries in the Data Search interface.
A word of caution: The pull down menu contains an "All Targets" option. This is the default value used for queries and returns all targets regardless of the condition flag. A user wanting a list of all targets with an assigned condition flag can add the condition flag as a "User specified field" and put an "*" or "%" in the field.
Return to the Table of Contents
GALEX News
There is a lot of big news coming out of the GALEX project these days.
Mission Closure (Maybe): As noted in last year's newsletter NASA has terminated operations of GALEX; the actual NASA termination date was deferred until mid-February. As of this writing the satellite is in officially in standby mode http://www.galex.caltech.edu/newsroom/glx2012-01f.html. However, there are hopes to keep its operations via another support mechanism. A further announcement can be expected very shortly; stay tuned to http://www.galex.caltech.edu/newsroom/releases.html. As part of the closure activities all scientific data products and documentation will be transferred to MAST.
GR7 deliveries: A GR7 release is coming to MAST in 2012, as usual in several stages. It will cover near-UV observations made in 2011. The GR7 areal coverage will include the Galactic cap, much of the low Galactic latitudes, almost all of the Small and Large Magellanic Clouds, additional regions in the Kepler field, and new visits to the M31. Observations made in calendar 2012 (until final shutdown) will most likely appear under a different name from GR7. The GR7 deliveries will proceed in the normal course of mission surveys, e.g. with the Medium Imaging and Nearby Galaxy surveys.
As the initial GR7 delivery, the project has delivered the so-called "raw6" survey. MAST plans to convert these files to photon list files early this year. This will set the stage for an on-line tool that will enable users to extract light curves for arbitrarily chosen sky regions or objects.
The GCAT delivery: Seibert et al. have announced the creation of two "GCAT" source catalogs (2012AAS...21934001S) called the All Sky Survey Source Catalog (GASC) and the Medium Imaging Survey Source Catalog (GMSC) These will be delivered to MAST in early 2012 and will form the final and unique identifications for sources detected by GALEX. As the source identifications will be (finally) unique, they will become the official reference for cross-lists for objects of other missions). Sources are included in the GASC or GMSC depending on their exposure times (<800 sec and 800-10000 sec, respectively). The Catalogs will extend to near-UV magnitudes of 21st and 23rd magnitudes, respectively, and the numbers of identified sources are 40 million (GASC) and 22 million (GMSC). A supplement to these catalogs based on GR7 products is currently planned.
MAST will keep users posted on GALEX closure and delivery activities on its news corners at
http://archive.stsci.edu and/or
http://galex.stsci.edu.
Return to the Table of Contents
Spectral Classes: A MAST Tool for Selecting Stars by Spectral Type
MAST has constructed a tool that associates "best" spectral types in the literature with targets observed in MAST's spectroscopic missions. Users can access this tool by clicking "Spectral Classifications" in the Tools tab at the top of the MAST home page or by navigating directly to http://archive.stsci.edu/spec_class. The tool is an interface form called "Spectral Classes of Like Stars." It allows queries for stars' spectral types, luminosity classes, and as many as 4 of the many spectral peculiarities appropriate to the queried spectral type. Ranges in spectral type are also permitted. The retrieval page gives the precise spectral classification for a star matching the query, a bibliographic reference for the classification, and details on how the match was made from the input star name (or coordinates) to classification catalogs. In addition, MAST now offers a tool that retrieves spectral types from the latest version of Brian Skiff's catalog of spectral classifications.
The Spectral Classes form comes with Tips, field descriptions, and help pages that enable users to customize and expand the usefulness of queries with minimal effort. One particular use case is to ask for all spectra in the MAST database for a given spectral classification. Although this tool facilitates research on individual stars, perhaps its forte is for use in compiling lists of stars and spectra for use in spectral atlases, or as a source of what is still missing in our archives - and therefore as a reference source supporting proposals for new UV/optical observations.
http://www.ivoa.net/Documents/Notes/SpectClasses/index.html .
Return to the Table of Contents
MAST HST Press Release Image Archive
MAST and the HST Office of Public Outreach have collaborated to create a database of HST press release data. The images included now contain Astronomy Visualization Metatags including the World Coordinate System. The database includes observatory and science observation information and links to related information and the original hubblesite.org press release. You will find full resolution tiff and jpeg format images containing metadata headers.
 You can find them through the following links:
- MAST search interface
- MAST Data Discovery Portal (demo version)
(select the collection: Hubble Press Releases (STPR)) - VO Data Discovery Tools
- VO Registry
- Astropix
This service provides easy access for:
- Informal science exhibits and visualization
- Online interactive applications
- Mobile apps
- Student research
- Curriculum support
Return to the Table of Contents
MAST Data Discovery Portal
MAST is developing a new web application for finding and retrieving data from all the MAST missions. This Data Discovery Portal will provide the following features through a single web interface:
- Access to MAST's diverse collections via a single query.
- Access to all Virtual Observatory data collections.
- Robust filtering mechanism for narrowing search results.
- Views and visualizations for interactive exploration:
- Preview images
- Observation footprints and catalog objects plotted on a sky background
- Context-dependent links to supplemental information and tools
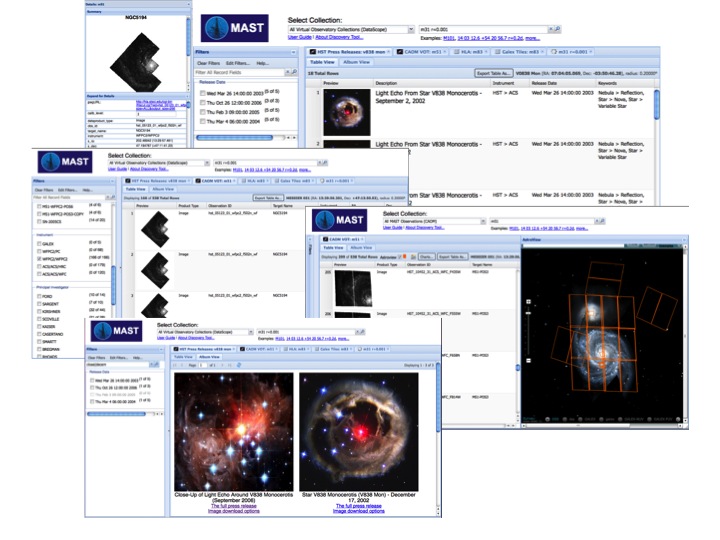
In order to make this tool as useful as possible, MAST is requesting your feedback on our initial progress. Please watch the video or try out the tool and send us suggestions for improvements and new features. Note that this is an early release for demonstration purposes only. Some links may not be active, and the ability to download data products has not been enabled.
As new features are developed, we would greatly appreciate continued feedback. If you are interested in helping to guide this project as a beta tester and/or with feature requests, please contact us at archive@stsci.edu.
Return to the Table of Contents
Community Contributed High Level Science Products
MAST welcomes contribution of high-level science products (HLSP) from the astronomical community. HLSP are community contributed, fully processed (reduced, co-added, cosmic-ray cleaned etc.) images and spectra that are ready for scientific analysis. HLSP also include files such as object catalogs, spectral atlases, and README files describing a given set of data. To find data two types of searches are provided: a Project search and a Product Search
The Three Multi-Cycle Treasury (MCT) Programs have already archived nearly 692 GB of data as HLSP. As new observations are obtained and processed, the MCT teams will continue to add to the holdings. Find and explore the data from these programs:
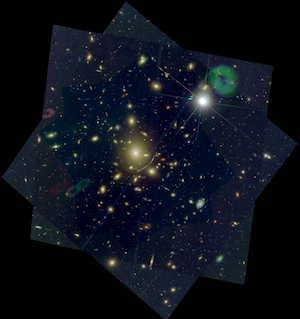 Abell 383 from CLASH Data |
 The PHAT team observations concentrate on the northeast quadrant of M31. Above is a CANDELS color mosaic of the EGS. Click on the image to explore the image in the HLA Interactive Display |
In the past few months several other teams have contributed science ready high-level science products for retrieval through the archive.
Other sets of HLSP that have been archived at MAST include:
- A set of comprehensive catalogues of hot star candidates in the Milky Way (MW), selected from Galaxy Evolution Explorer (GALEX) far-UV (FUV; 1344-1786 A) and near-UV (NUV; 1771-2831 A) imaging produced by Luciana Bianchi and team. Also included are catalogs cross-matching GALEX and SDSS DR7.
- A USNO-Kepler catalog provided by Karen Kinemuchi. The table contains every object in the USNO B1.0 catalog found within the Kepler field-of-view (FOV).
- The Galaxy Halos, Outer disks, Substructure, Thick disks and Star clusters (GHOSTS) survey team archived science ready images and catalogs. The team provided a very nice dynamic website to enhance exploration.
The image to the right shows the footprints for observations taken around NGC 4244. Clicking on the image will take you to a larger interactive version provided by the team. When the fields are clicked, you will see comparison images for each filter and the combined image as well as other types of data.
- Images and source catalogs resulting from the HST/NICMOS Paschen-α Survey of the Galactic Center led by Wang are now available from MAST.
To the right is the NICMOS mosaic of the Galactic Center in the p-α filter created using the HLA Interactive Display. Click on the image to explore it using the HLA interactive display interface.
- Catalogs and images that are products of the HST Treasury program ACS Galactic Globular Cluster Survey (PI: Ata Sarajedini).
The team used the ACS/WFC instrument to obtain uniform imaging of 65 of the nearest globular clusters to provide an extensive homogeneous dataset for a broad range of scientific investigations.
To the right is the HST press release image of M13. By clicking on the image you will be directed to the HLA interactive display allowing you to explore the F606W image delivered by the team.
- Contributed products from the Hubble Infrared Pure Parallel Imaging Extragalactic Survey (HIPPIES) team. The team utilizes long-duration pure parallel visits (~> 3 orbits) of HST at high Galactic latitude (|b|>20o) to take deep, multi-band images in WFC3 (since Cycle 17) and in ACS (starting Cycle 18). It is unique in its large number of descrete fields along random sightlines, and thus is complementary to other surveys over contiguous fields but along limited sightlines.
To the right is a color composite image of parallel field par0623-6439. If you click on the image, you can explore it using the HLA interactive explorer interface.
- The The Hubble Ultra Deep Field 2009 (HUDF09) team team delivered science ready images. The program used WFC3/IR as the prime instrument for 192 orbits to image the deep ACS fields that were obtained in the original HUDF.
The image to the right is a color-combined image of the F160W, F125W, and F105W data. By clicking on the image you will bring up the HLA interactive display of this combined image.

- The Planet Pipeline Project led by Max Mutchler prepared a special search optimizing for moving-target data taken with the WFPC2 camera.
Return to the Table of Contents
MAST Users Group and Survey
MAST administers a user survey shortly before the annual MAST Users Group (MUG) meeting. The results of the survey and a response to some of the comments and questions are posted online.
The MUG met on September 23, 2011. The presentations and the report from the MUG are also posted online.

Return to the Table of Contents
To Subscribe or Unsubscribe to the Newsletter
If you would like remove yourself from the mailing list send mail to archive_news-request@stsci.edu and put the single word unsubscribe in the BODY of the message. Information on the subject line will be ignored.If you would like to subscribe to the mailing list to receive notification of future Archive Newsletters, send mail to archive_news-request@stsci.edu and put the single word subscribe in the BODY of the message. Information on the subject line will be ignored. You will be asked to confirm the subscription.
|
|
|


 Follow Us


