


 Follow Us
|
|

Common Data Problems
Data taken with the Copernicus spectrometer is usually quite easy to deal with after determining the background, however there are still a number of things that could go wrong that one has to watch out for when dealing with these datasets. It is particularly important when using Copernicus data to look at the individual scans as well as the final stacked scan to be sure you do not miss any drifts, glitches, overflows, etc that can distort the final stacked output. Some (but by no means all) of the problems that can occur in Copernicus data are shown in the examples that follow, as well as some suggestions for how to spot these problems.
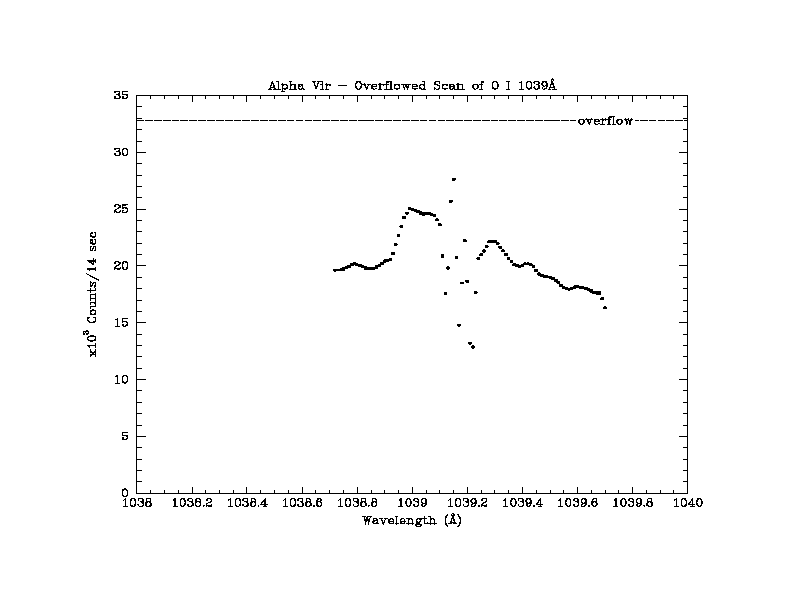
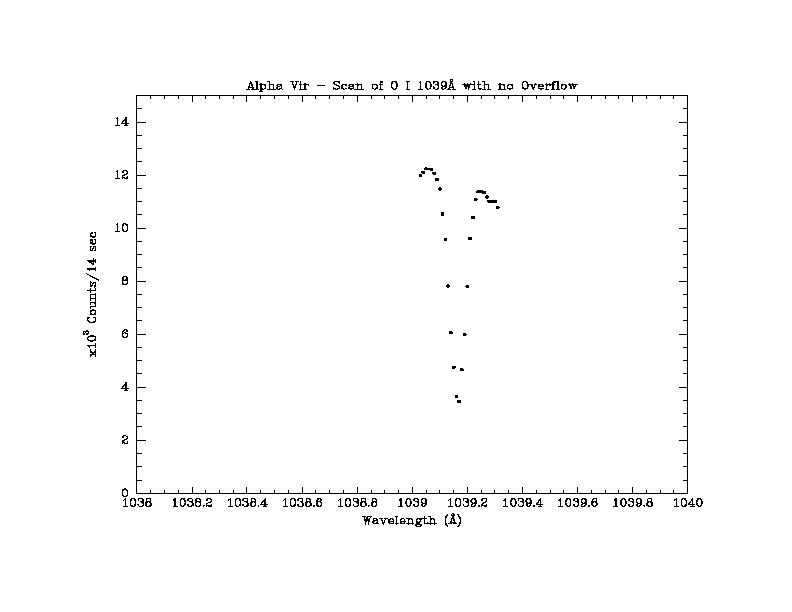
At the beginning of the mission the sensitivity of the instrument was quite high, occasionally the number of counts recorded during a scan exceeded the number of counts that could fit in the data buffer (32,767 counts in 14 seconds), when this occurred the counts "wrapped around" and restarted at zero. This can be most easily seen by comparing two scans of the same spectral region, the following figures show two scans of the O I line at 1039Å line towards the star alpha Vir, the first shows a scan where the continuum has overflowed the data buffer, and the second a scan taken at a later date when the instrument sensitivity had declined --
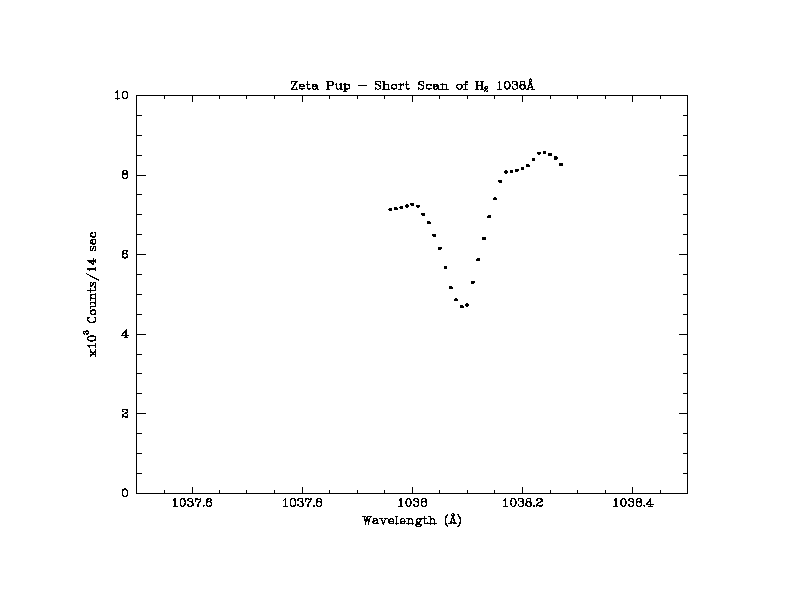
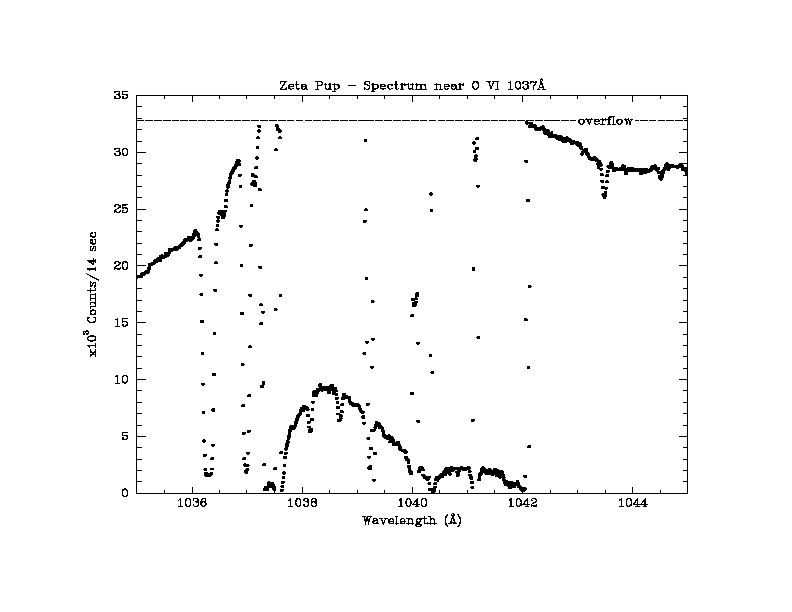
Since scans of single lines usually included only a small range of wavelengths (and thus sampled only a short section of the continuum) it can often be difficult to determine when an overflow has occurred. Since strong lines will be near zero in their cores and thus can only overflow in the wings of the line and in the continuum, one can find the approximate wavelength range over which overflows are likely to have occurred. The following two figures show a case where a scan of a (relatively weak) line does not provide enough information to identify this wavelength interval as one where the data registers overflowed, the continuous scan taken at roughly the same time shows that this data is in fact overflowed:
The correction for an overflow where only a section of the data in a stacked scan has overflowed (especially where the transition occurs within a line of interest) is in generally not possible unless the entire region of interest has overflowed. In cases (such as the scans of the 1039Å line towards alpha Vir) where the transition occurs in the middle of the region of interest one must go back to the raw (and thus un-interpolated) data, correct the overflow by adding 32767 counts to the appropriate fluxes, and then re-stack the data.
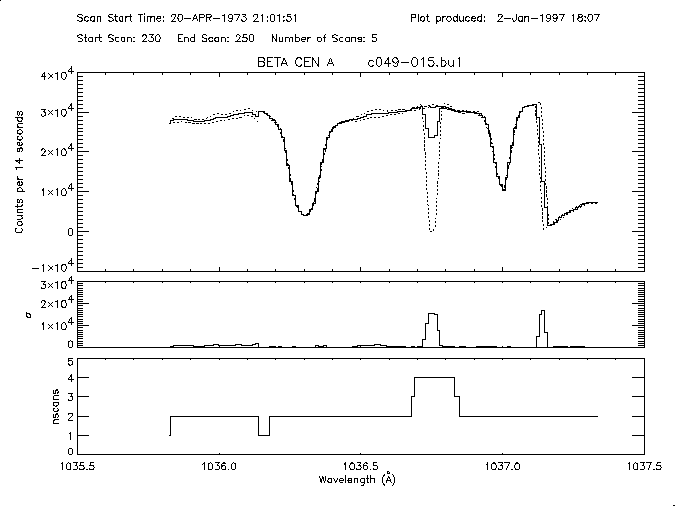
One must be very careful to check the individual scans for overflows whenever the countrate is near 32,000 counts per 14-second. Overflows of single wavelength points can occur in one or two of a group of scans and create a false line as is shown here:
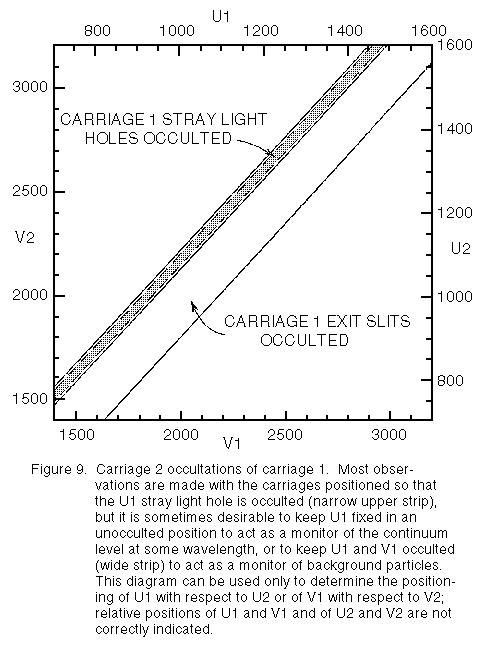
Besides overflows there are also spurious decreases and/or increases in the countrates in some scans. The most likely cause of a decrease in the countrate is pointing error, while increases in the countrate are generally caused by a rise in the particle background (see below). In general such changes are not caused by variations in the amount of stray light being blocked by to carriage-2, although this can only be ruled out by a point-by-point comparison of the U1/V1 and U2/V2 positions with Figure 9 of the Guest Investigators Guide.
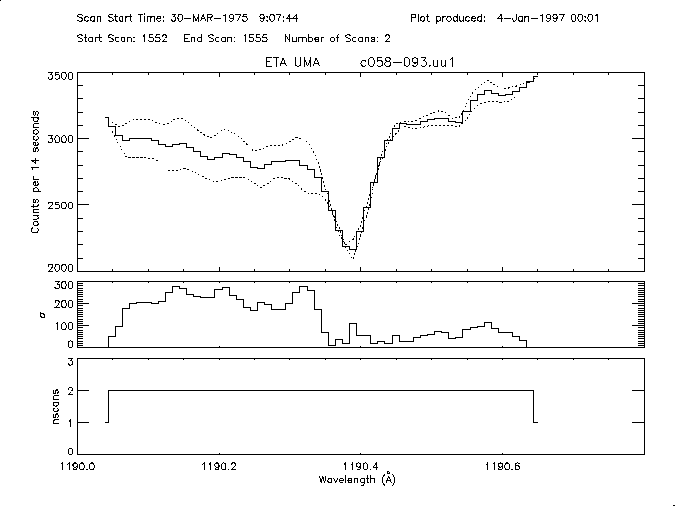
The spacecraft pointing accuracy was generally about 0.02 arc seconds during the typical single scan of spectral lines, this was good enough so that the counts are usually not noticeably affected by guidance changes. However, occasionally the spacecraft drifted, which results in a sudden and often temporary drop in the count rate during a scan. These figures show examples of apparent tracking errors, note the large variation in the net flux between scans:
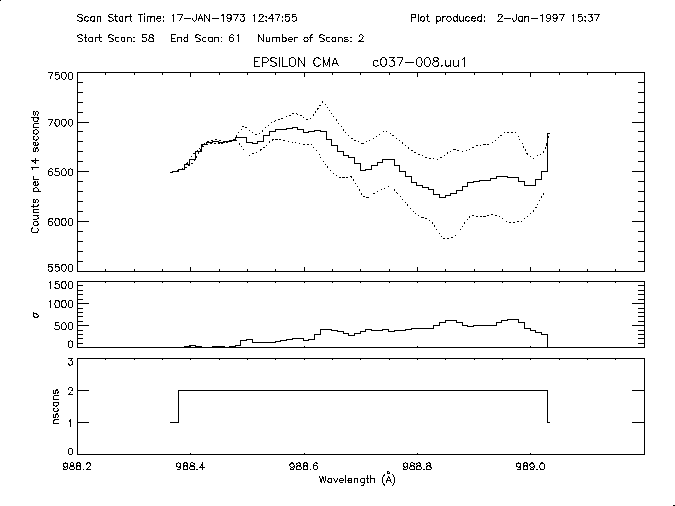
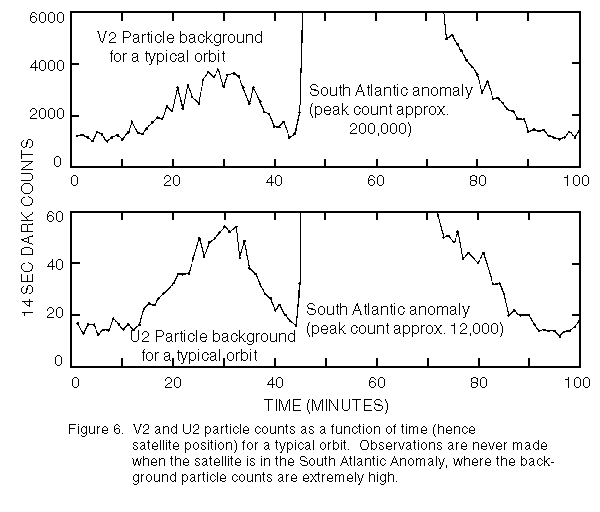
Occasionally one sees sudden increases in the count rate during a series of scans of a single line. Such changes are generally attributable to a rise in the particle background. While observations were generally planned so as to avoid the South Atlantic Anomaly (SAA) where the particle background is large, occasionally the edges (which were not that well defined) of the SAA were crossed. There are also a few observations that were taken during a crossing of the SAA itself, such scans are characterized by a larger than usual background (listed in the TBACK column of the raw data). Figure 6 of the Guest Investigators Guide shows the typical variation in particle background within an orbit.
compiled by jtl
|
|
|