
STScI Newsletter
2023 / Volume / Issue
About this Article
MAST Staff - 2023 Oct 30New & Updated HLSPs for October
New
- The Great Observatories All-sky LIRG Survey (GOALS) combines imaging and spectroscopic data from NASA's Spitzer, Hubble, Chandra, and GALEX space-borne observatories in a comprehensive study of over 200 of the most luminous infrared-selected galaxies in the local Universe. The sample consists of nearly 180 Luminous Infrared Galaxies (LIRGs) with luminosities above 1011 L☉, as well as 22 Ultra-Luminous Infrared Galaxies (ULIRGs) with luminosities above 1012 L☉. The LIRGs and ULIRGs targeted in GOALS span the full range of nuclear spectral types (type-1 and type-2 AGN, LINERs, and starbursts) and interaction stages (major mergers, minor mergers, and isolated galaxies). They provide an unbiased picture of the processes responsible for enhanced infrared emission in the local Universe and are excellent analogs for infrared and sub-millimeter-selected galaxies at high redshift. View the GOALS page >
Updated
- GSFC-ELEANOR-LITE light curves for Sector 9 are now available at MAST. This Sector adds 7,054,161 light curves to the collection. There are now nearly 40 million GSFC-ELEANOR-LITE light curves available. View the GSFC-ELEANOR-LITE page >
- TICA calibrated, quick-look TESS FFIs for the following orbits are now available in MAST:
- Sector 71 Orbit 1 Part A
- Sector 70, all orbits and parts
- TESS-SPOC calibrated light curves and target pixel files from TESS full frame images for Sector 61 are now available at MAST. This Sector adds 159,997 targets derived from 200-second cadence FFIs. View the TESS-SPOC page >
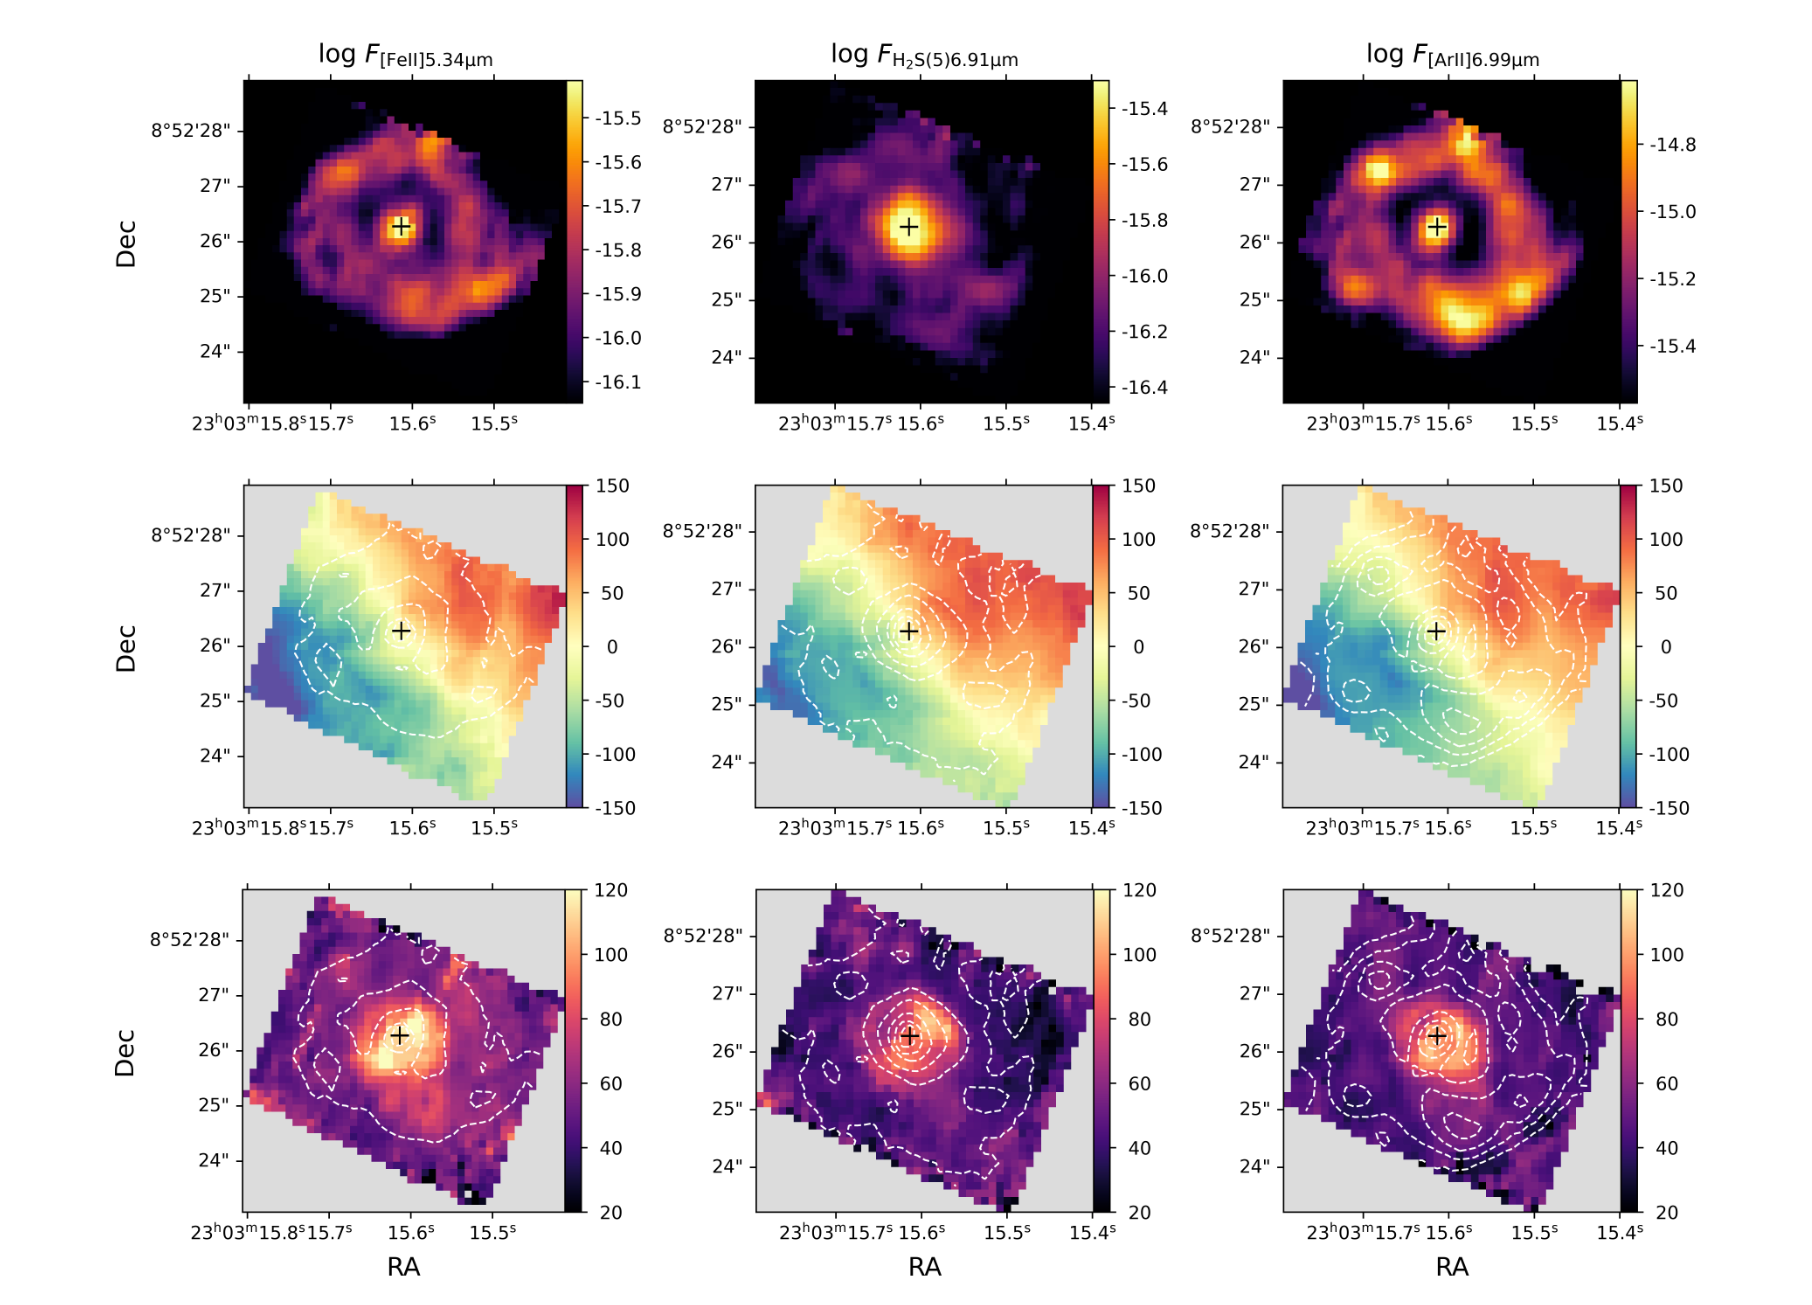
From the GOALS HLSP, this plot shows the distribution of flux (top; in log ergs-1 cm2 pixel-1), velocity (middle; in km s-1 ), and velocity dispersion (bottom; in km s-1) for several bright emission lines in Channel 1: [Fe Il] 5.34μm (left), H2 S(5) 6.91 μm (middle), [Ar II] 6.99 μm (right).
Contours based on the flux distribution are overlaid on the kinematic maps of the respective gas species. The black cross marks the peak of the H2 emission. North is up, and East is to the left. The distributions of the molecular and ionized gas emissions are strikingly different, with H2 being preferentially bright at the center while FeII and Ar II appear clumpy at the star-forming ring. H2and [Fe II] exhibit enhanced dispersion ~ 180 pc off the nucleus.