
STScI Newsletter
2025 / Volume / Issue
About this Article
MAST Staff - 2025 Jul 28Updated HLSPs
- Mega-MUSCLES v25: SEDs for a dozen stars are now updated with DEM models for the Extreme Ultraviolet and provide model uncertainties. More details in Wilson et al. 2025.
- SMARTS DR2 provides 1 million simulated stellar light curves designed to mimic the Kepler Bonus Background data. Includes rotational variability from star spots, stellar activity cycles, and latitudinal differential rotation for the 4-year Kepler baseline.
- TESS-SPOC was updated with calibrated light curves and target pixel files from 200 second TESS full frame images for the following sectors:
- Sector 75 — 159,999 targets
- Sector 76 — 160,000 targets
- TICA quick-look calibrated full frame images from the following orbits are now available at MAST:
- Sector 93, complete
- Sector 94
- Orbit 1, complete
- Orbit 2, Part A
- QLP calibrated light curves from TESS full frame images for Sector 92 are now available at MAST. This Sector adds ~ 2 million targets derived from 200 second cadence FFIs
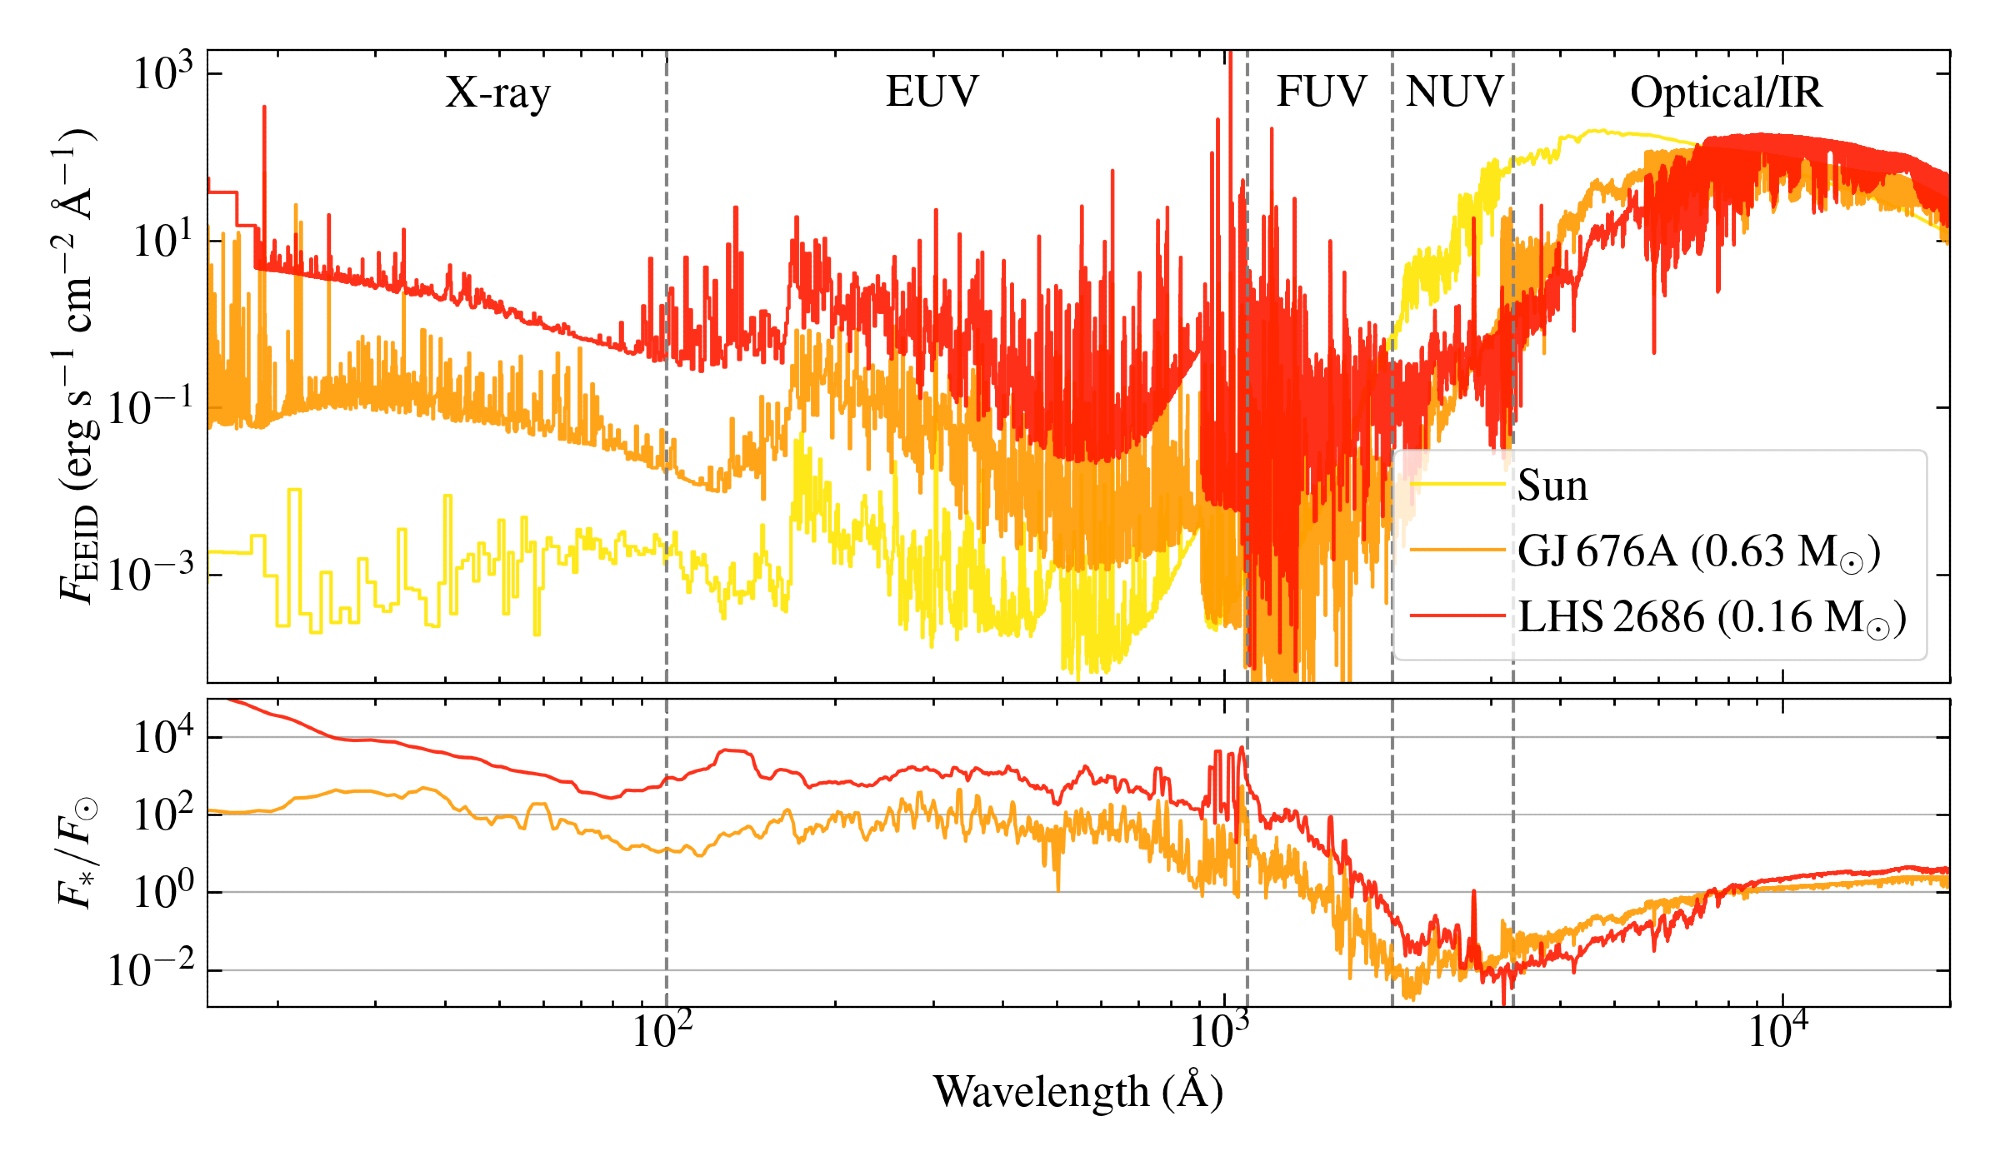
Top panel: SEDs of the hottest (GJ 676A) and second coolest (LHS 2686) compared with that of the Sun (Woods et al. 2009). The spectra are scaled to the Earth Equivalent Installation Distance (EEID, Mamajek & Stapelfeldt 2023).
Bottom panel: The flux ratios of the scaled M dwarf SEDs to the Solar SED.
If you are thinking about contributing a High-Level Science Product of your own, please fill out the HLSP Interest Form to get started. HLSPs archived on MAST enjoy permanent hosting space, additional visibility, and, often, increased citation rates. Any further questions on the process can be sent to the Archive Help Desk.