
Mission Overview
The TESS All-Sky Rotation Survey (TARS)
Primary Investigator: Andrew Boyle
HLSP Authors: Andrew Boyle, Luke Bouma, Andrew Mann
Released: 2026-06-03
Updated: 2026-06-03
Primary Reference(s): Boyle et al. 2026
DOI: 10.17909/2sff-fn29
Citations: See ADS Statistics
Overview
NOTE: As of 2026-06-03, Sectors 1-26 are available from MAST. Ingest of sectors 27–96 is ongoing. Upon completion, this message will be removed.
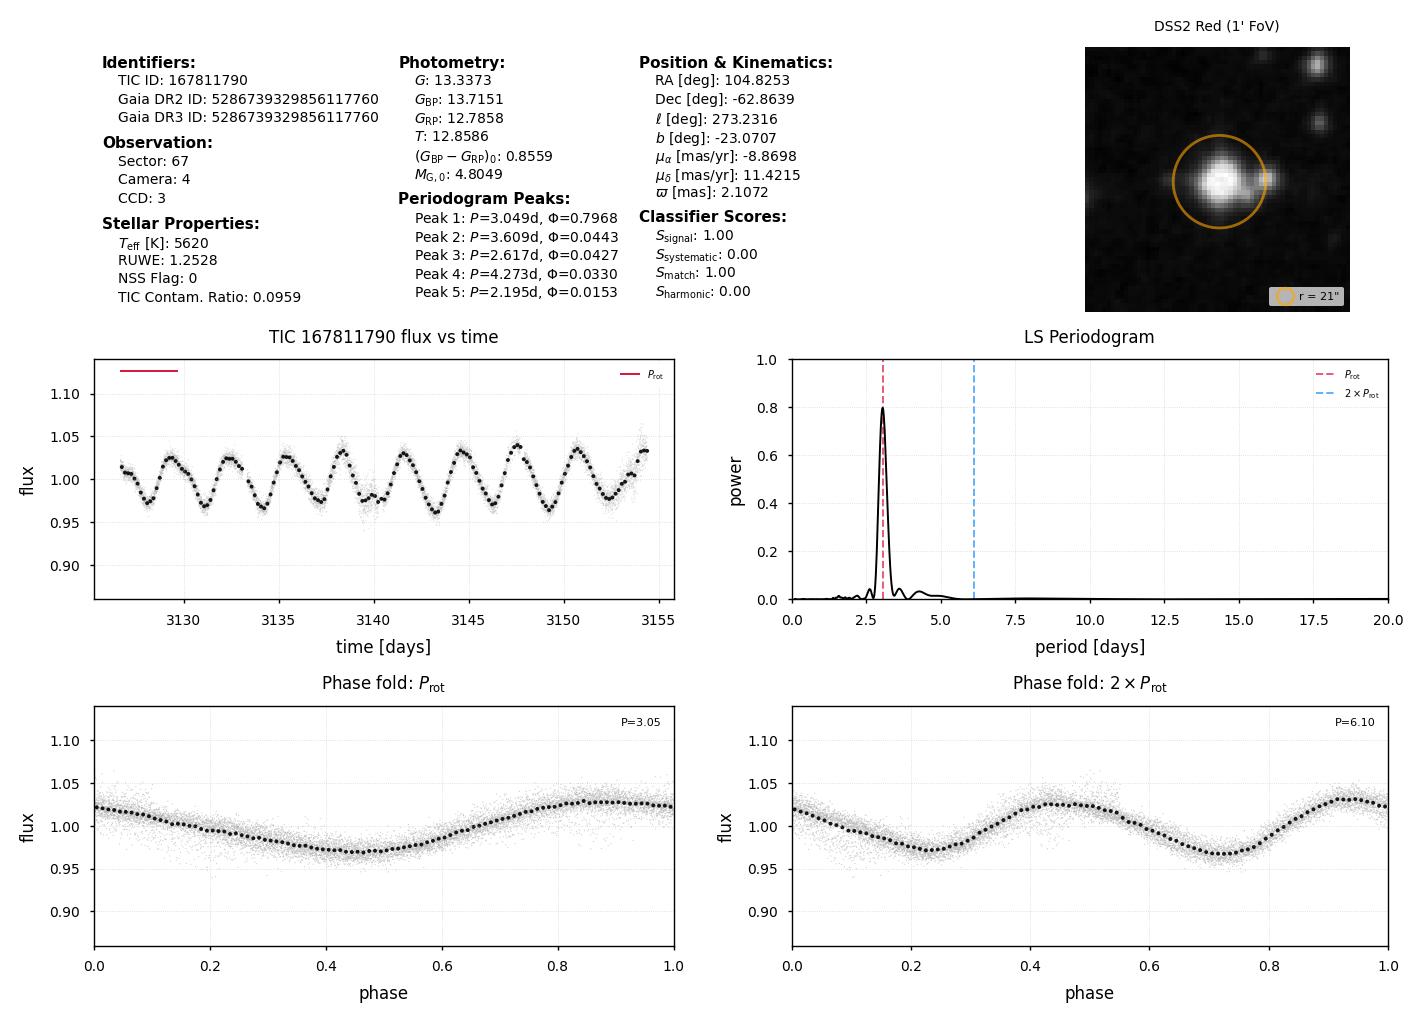
The TESS All-Sky Rotation Survey (TARS) provides systematics-corrected light curves and Lomb-Scargle periodogram measurements for 39 million star-sector combinations spanning 7.5 million unique target stars observed by TESS between Sectors 1 and 96 (2018 July - 2025 September). Targets were selected from the TESS Input Catalog (TIC v8.2) with TESS magnitude T < 16 and parallax greater than 2 mas (d < 500 pc). Light curves were extracted from TESS full-frame images using the unpopular causal pixel model to remove instrumental systematics, and periodograms were computed using the Lomb-Scargle algorithm as implemented in astropy. For each target, the team provides the light curve, periodogram measurements, and a vetting plot summarizing the periodicity analysis and stellar properties.
Each light curve file contains the systematics-corrected time series and period finding results for a Lomb-Scargle periodogram evaluated over periods from 0.1 to 20 days. The light curve header stores the light curve itself as well as the periods, powers, signal-to-noise ratios of the five highest peaks in the periodogram, and derived quantities used in the TARS classification pipeline, including the best-fit sinusoid amplitude, point-to-point RMS, and Bayesian Information Criterion values for one-term and two-term sinusoidal models. The accompanying vetting plots provide a visual summary of each measurement.
Data Products
The TARS team provides custom-reduced TESS light curve files in FITS format as well as vetting plots for each light curve in JPEG format.
Data file naming convention:
hlsp_tars_tess_ffi_s<sector>-<tic_id>_tess_<version>_<product>.<ext>
where:
- <sector> is the TESS sector number, zero-padded to 4 digits
- <tic_id> is the TIC ID, zero-padded to 16 digits
- <version> is the data release version ("v01" for this release)
- <product> is the data product type
- <ext> is the file extension, either "fits" or "jpeg" depending on the product type.
Data file types:
| _lc.fits | light curve in tabular FITS format |
| _preview.jpeg | vetting plot in JPEG format |
Data Access
MAST Portal and Astroquery
The TARS data products are available in the MAST Search Portal (web-based, cross-mission search interface) and Astroquery (Python package to search for and download files from Python scripts you write).
- In the MAST Search Portal, set the Provenance Name filter to "tars" in an Advanced Search to find these data. The user guide for how to search and download products using the MAST Portal is available here.
- For Astroquery, the following example code demonstrates how to search for and download 1,000 products from TESS Sector 1. TARS is large, so you may want to consider narrowing large searches (> 10 GB) or those with many individual files (> 10k). You can find more astroquery.mast tutorials here.
from astroquery.mast import Observations
# Search for all <HLSP-NAME> products
all_obs = Observations.query_criteria(provenance_name="tars", sequence_number=1)
data_products = Observations.get_product_list(all_obs[:1000])
# Print the number of data products that would be downloaded
print(len(data_products))
# Download data
Observations.download_products(data_products)
-
A web-based interface for cross-mission searches of data at MAST or the Virtual Observatory.
-
Search for and download data products for this HLSP programmatically in Python.

