

About this Article
MAST StaffNew HLSPs
TARS provides systematics-corrected light curves and Lomb-Scargle periodograms for 39 million star-sector combinations (7.5 million unique stars) observed by TESS between Sectors 1 and 96 (2018 July - 2025 September). This dataset includes all nearby stars (< 500 pc) brighter than 16th TESS magnitude. Light curve files contain systematics-corrected timeseries and the results of the running a Lomb-Scargle periodogram, evaluated over periods of 0.1 to 20 days. For easy access, the light curve header stores the periods, powers, signal-to-noise ratios of the five highest peaks in the periodogram, and derived quantities used in the TARS classification pipeline, including the best-fit sinusoid amplitude, point-to-point RMS, and Bayesian Information Criterion values for one-term and two-term sinusoidal models.
Updated HLSPs
PHANGS-CAT has built an integrated dataset for multi-phase, multi-scale studies of star formation. Data Release 5 (DR5) provides HST photometry with improved estimates of age, mass, and reddening, across the full sample of 38 PHANGS-HST spiral galaxies.
Scylla adds 1.5 million new stellar SED fits and dust maps for 60+ fields across the SMC and LMC. SED fits provide stellar mass, age, distance, metallicities, and dust properties. Parsec-scale dust maps provide 10x higher resolution than existing maps.
TESS-SPOC calibrated light curves and target pixel files from TESS full frame images for the "Comet 3I" Sector 1751 are now available at MAST. This Sector adds 159,993 targets derived from 200 second cadence FFIs.
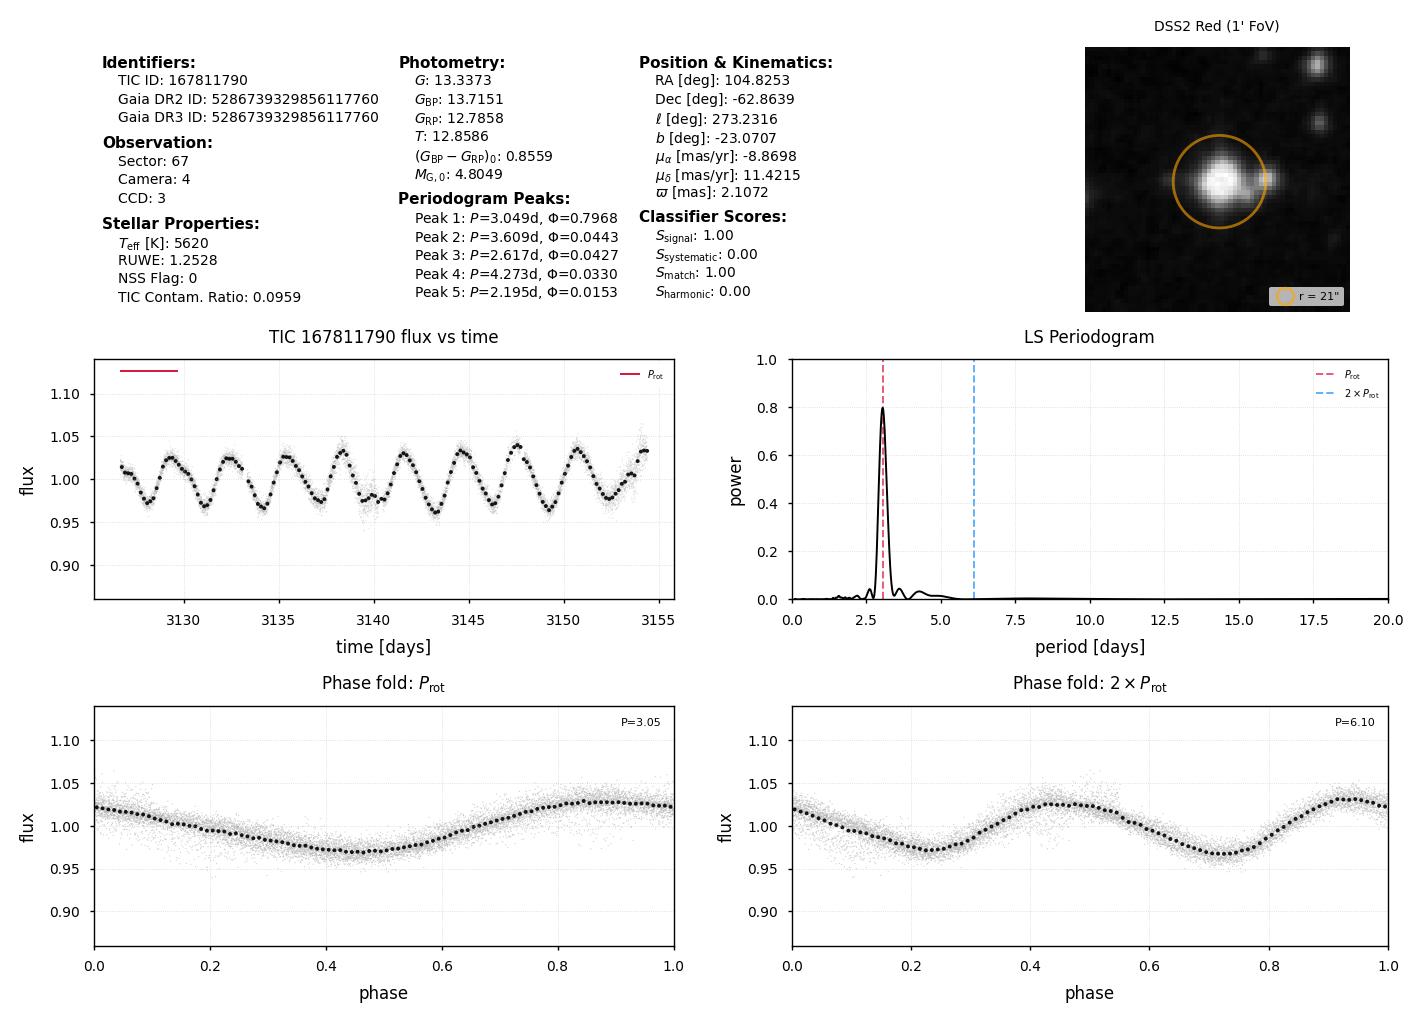
Top: Summary of stellar identifiers, observing parameters, Gaia photometry and astrometry, derived stellar properties, random forest classifier scores, and the periods and powers of the five highest periodogram peaks.
Middle left: Systematics-corrected TESS light curve with time in Barycentric TESS Julian Date (BTJD). The horizontal bar indicates the detected period.
Middle right: Lomb-Scargle periodogram with the detected period (dashed red) and twice the period (dashed blue) marked.
Bottom left: Light curve phase-folded at the detected rotation period with the best-fit sinusoid overplotted.
Bottom right: Light curve phase-folded at twice the detected rotation period to aid in identifying half-period aliases. Gray points show individual measurements; black points show phase-binned medians.